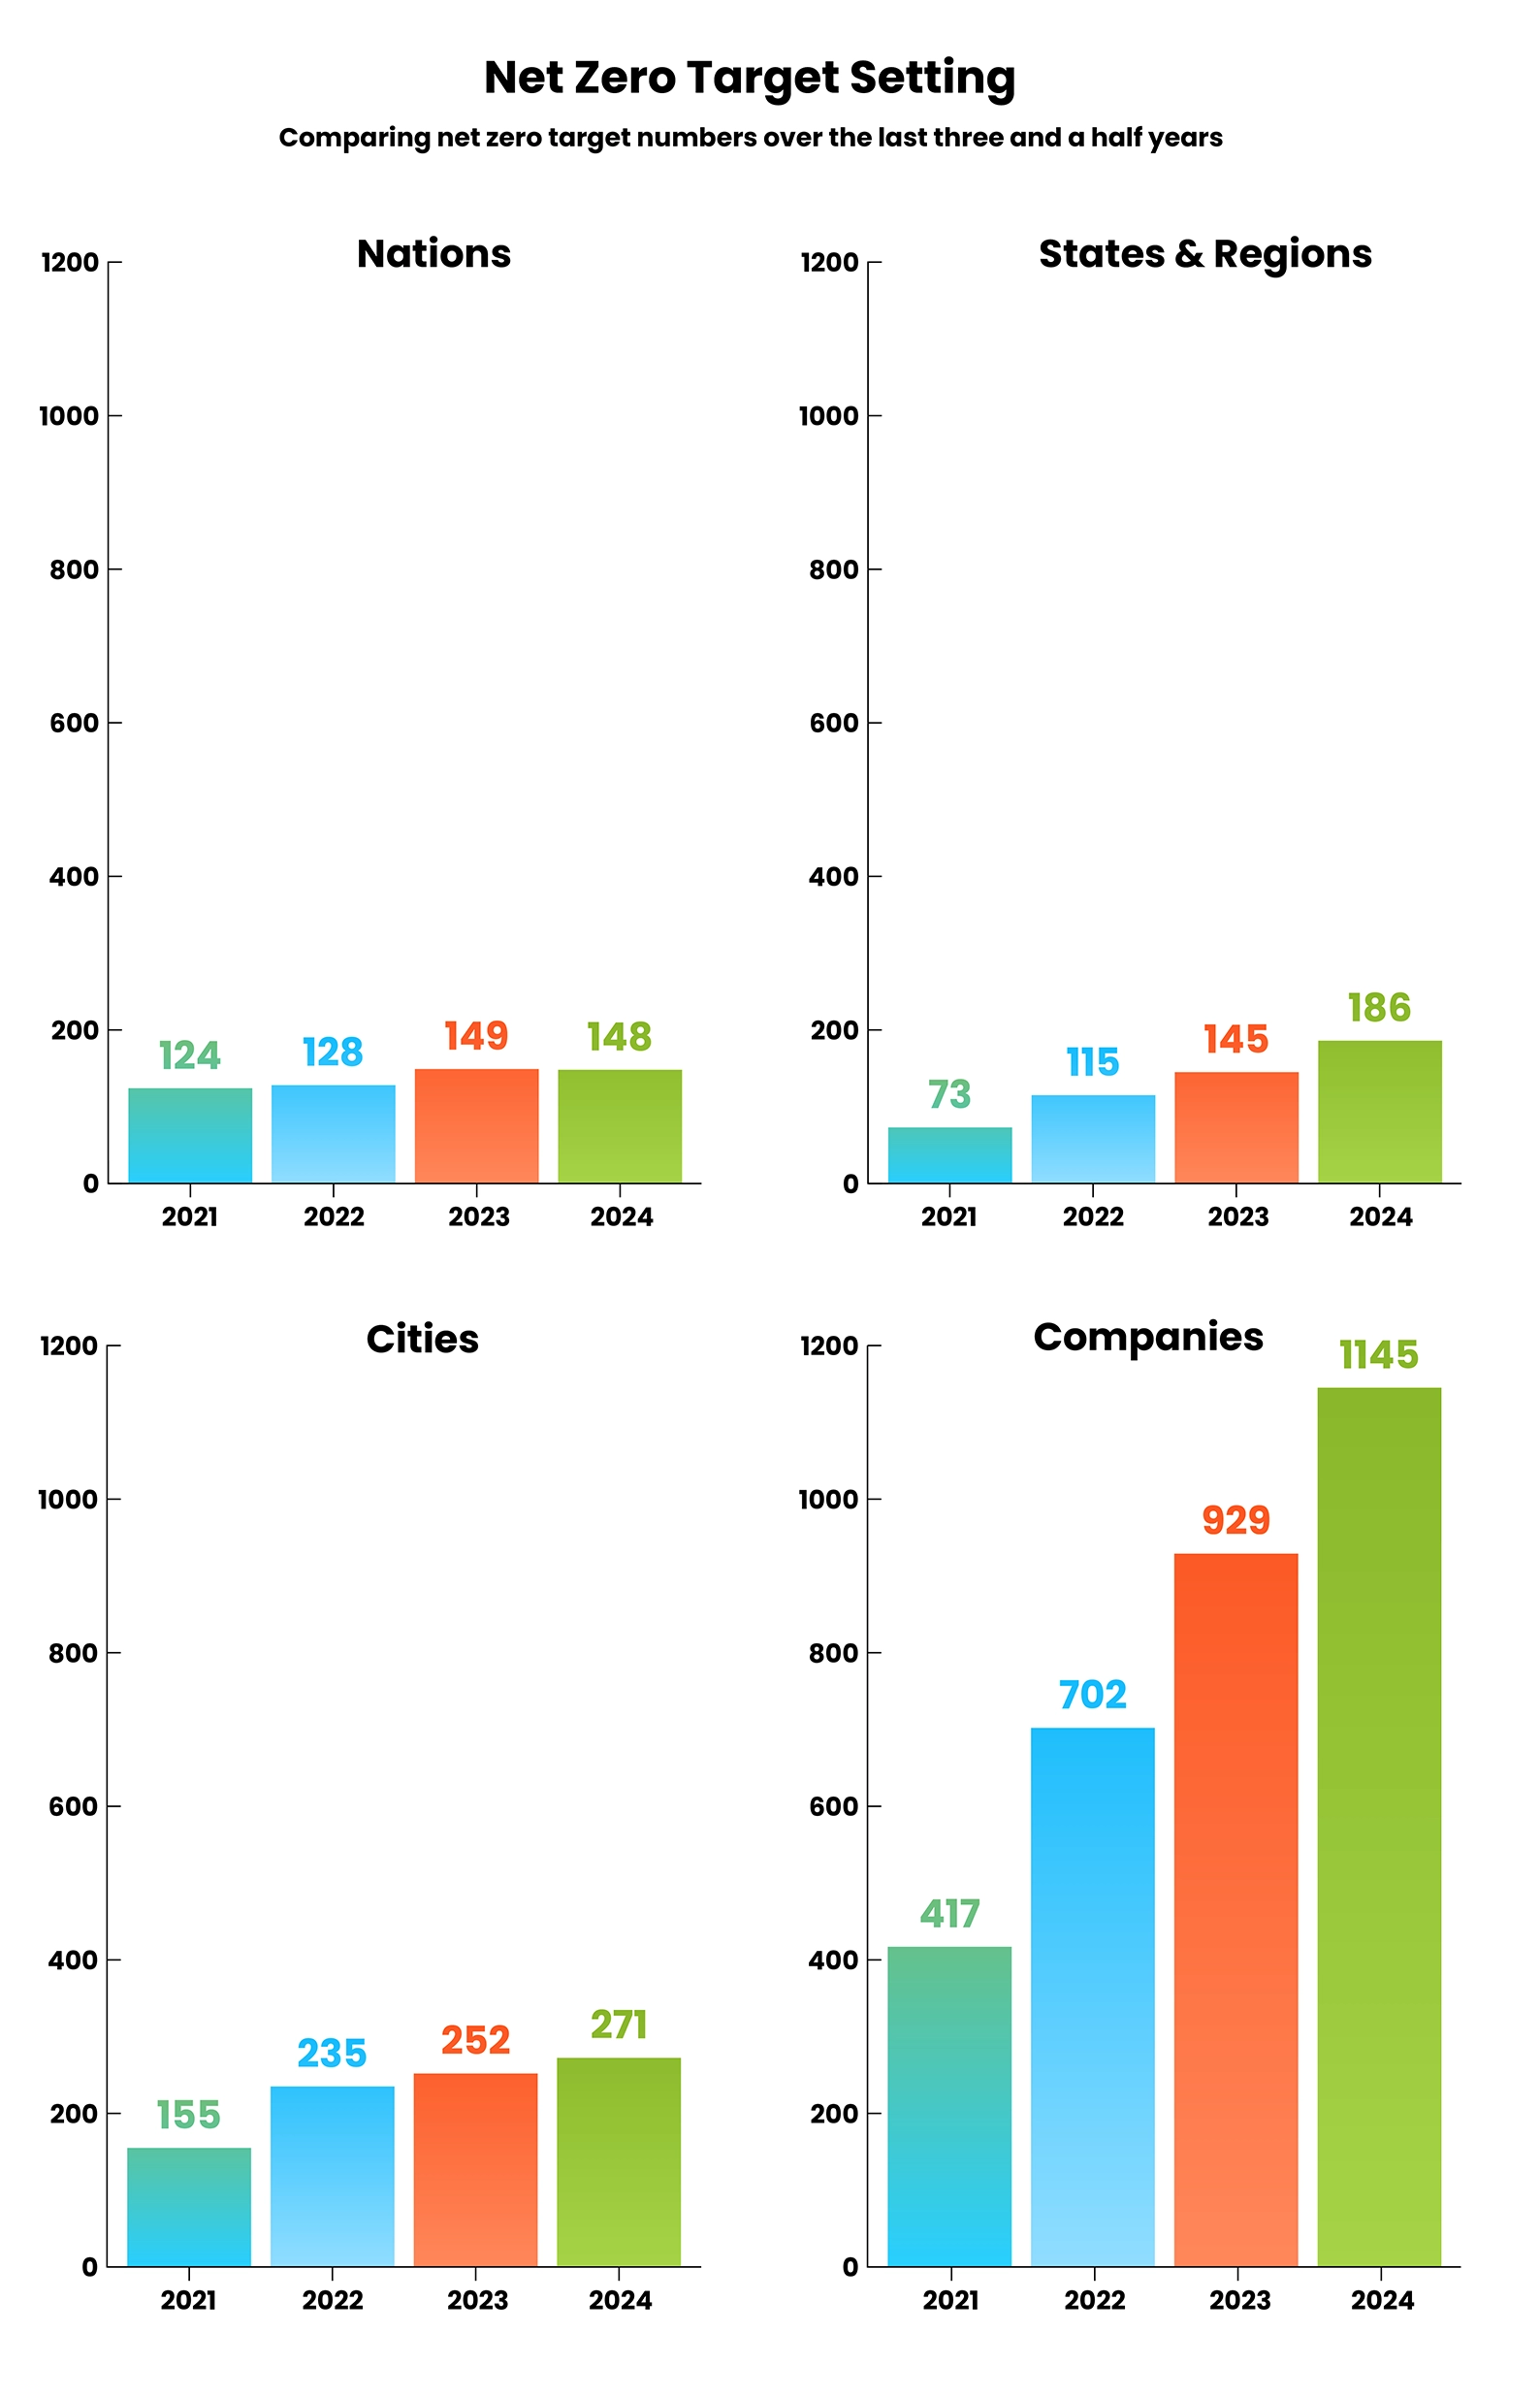
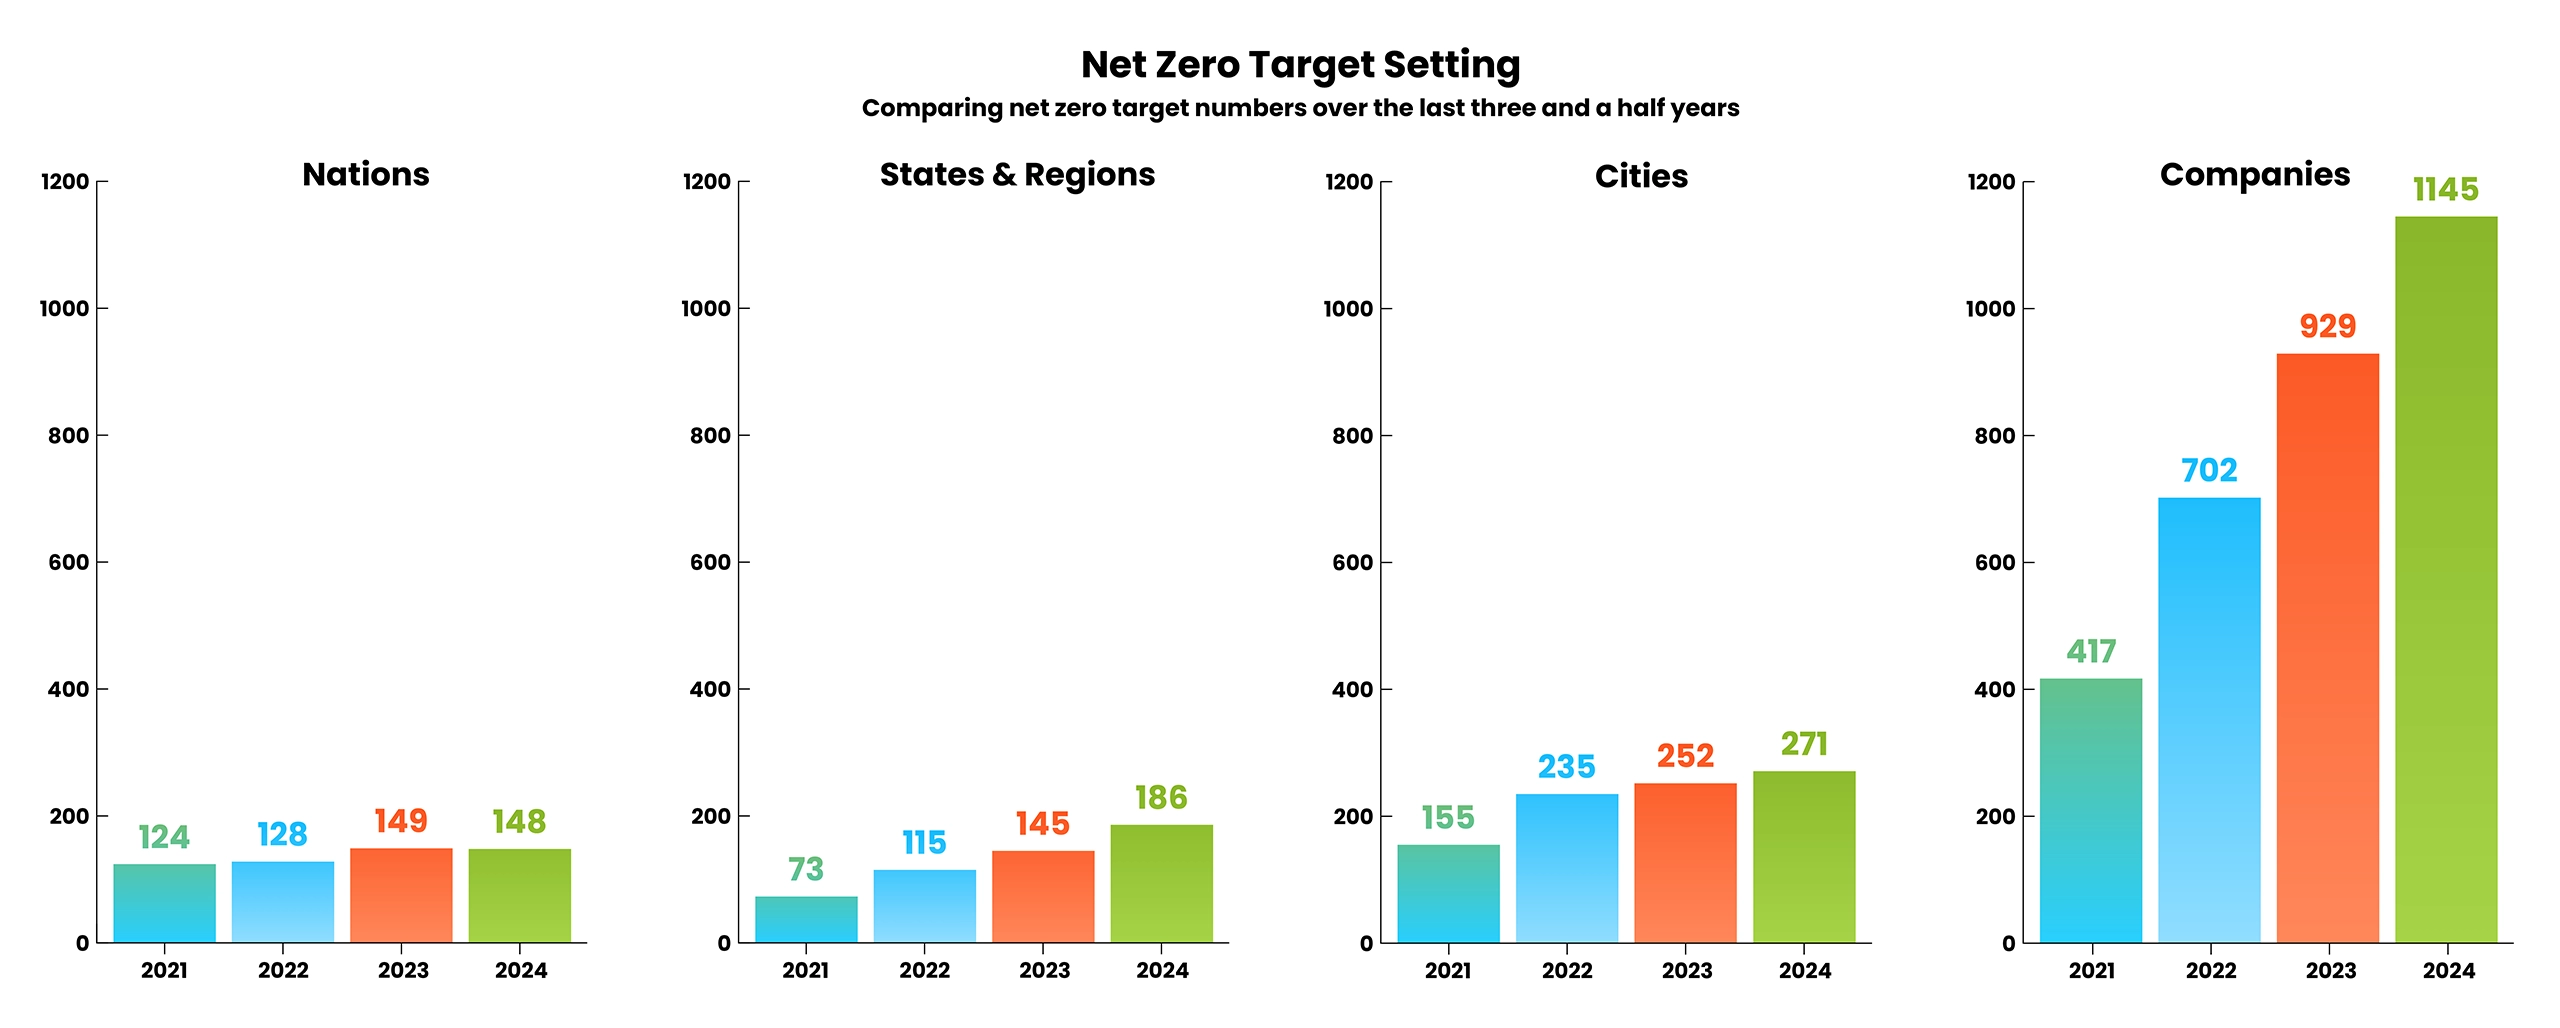
On this page…
The World is Already Doing More Than You May Know
Addressing the crisis is largely about moving away from fossil fuels. This global transition to clean energy is well underway as you will see below. Fossil fuels will largely be replaced with electrification using clean sources of energy. But we need to accelerate the transition to avoid the worst impacts of climate change.
The information below will show that we are finally starting to get the kind of traction needed to bend the curve towards a safer future — notwithstanding the barriers and adversity.
Some governments, NGOs, businesses, and citizens have been fighting against the climate crisis for over 50 years. More pervasive and ambitious action has been building momentum over decades and has dramatically increased over the last 5–10 years.
More and more companies, national and subnational governments, NGOs, and individuals are embarking on climate action journeys with increasing ambition over time.
Concerted global efforts to reduce emissions of greenhouse gases that are causing global warming and climate change stretch back to at least the 1980s. Some key dates and milestones are as follows:
The Intergovernmental Panel on Climate Change (IPCC) was formed to assess the science regarding the sources of greenhouse gas emissions, the social and economic impacts, and potential response strategies to climate change1.
The United Nations Framework Convention on Climate Change (UNFCCC) was ratified by 198 participating countries with the main aim of preventing “dangerous” human interference with the climate system by stabilizing greenhouse gas concentrations within a timeframe that would allow for ecosystem adaptation, food system security, economic stability, and sustainable development2. The IPCC had the mandate of establishing what “dangerous” levels meant based on the synthesis of global scientific knowledge.
Periodic comprehensive reports from the IPCC providing increasing clarity and consensus around the human-induced impacts of the climate crisis, the risks of the crisis in relation to different temperature thresholds (above pre-industrial levels) and the climate change mitigation strategies we need to implement to keep warming at a level that will not trigger runway climate change through feedback loop trigger points3.
The results of 10,000s of peer-reviewed scientific papers relying on many raw data sources and models from researchers across the globe are synthesized to generate a consensus view supported by 97–99% of the world’s climate scientists.
Annual meetings of the UNFCCC member parties called the Conference of the Parties to the Convention (COP) involving representatives from almost 200 nations and 1000s of other companies/non-profit organizations/scientists/consultants/lobbyists and citizens, to keep pushing forward on global climate change mitigation (preventing further global warming), climate adaptation (preparing for the impacts of climate change) and recovery from loss and damage from climate change in a just and equitable manner4. You can see the decisions and outcomes of these meeting here.
UNFCCC countries submit national inventories of their greenhouse gas emissions that show the sources of their emissions, emissions trends and emissions reductions based on sector and geography and National Inventory Submissions 2024.
Canada’s is here: Canada 2024 National Inventory Document
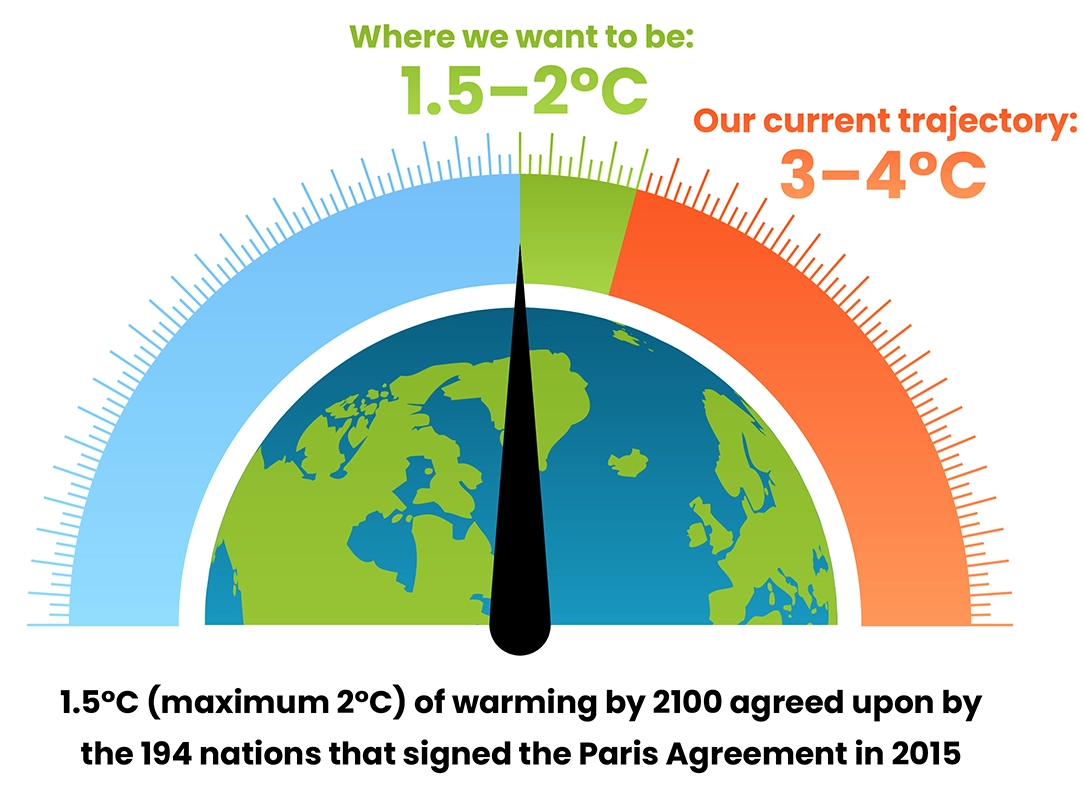
The Paris Agreement, a legally binding agreement to try to limit global warming to 1.5°C above pre-industrial levels (or well below 2°C), is signed by 194 countries and the EU.
As part of the Paris Agreement compliance, countries agreed to submit and update climate action plans.
You can see these here (including Canada’s, which includes Provincial Action Plans as well.)
Starting in 2024, reporting includes the actions countries have taken to date and how they relate to emissions reduction and targets.
The Paris Agreement also intentionally built in a mechanism for countries to increase ambition over time because change is hard to implement all at once and because as the crisis gets worse, we need to take greater action.
Another significant step forward occurred in 2018 when the IPCC provided a target of Net Zero emissions by 2050 to have a good chance of achieving the 1.5°C goal.
COP28 was held in Dubai and had over 90,000 attendees — most nations in the world including the Petro States agreed that we all need to transition away from Fossil Fuels in alignment with the Net Zero 2050/1.5°C goal.
At COP28, 132 countries and the EU also pledged to triple renewable energy capacity and double the rate of energy efficiency by 2030.
COP29 is held in Azerbaijan with a key focus on climate finance.
The world is on board, however…

The world is on board with taking action; the just transition away from fossil fuels and towards clean energy (as well as other transformations in the food system and carbon sequestration efforts) is well underway and is not going to go backwards — despite some opposition from the fossil fuel industry, and political road bumps and technical challenges.

The world is on board with making the transition just and equitable for both the workers in the fossil fuel sector that need to transition into other sectors and for those most impacted by the crisis — particularly considering that many of the most vulnerable to climate change contributed very little to the problem.

The energy transition is a monumental task that requires a lot more action from governments, business, the financial sector, and citizens in order to reach the target. We all need to act and to support each other’s efforts.

We are not on track for Net Zero 2050, many people are already impacted by the crisis, the natural world is already suffering, and we are not out of the woods from hitting trigger points that could cause runaway warming. We have to do more now.
A super simplified depiction of the enormous and extremely complicated climate change mitigation path might look like this:

How is the world progressing on the path above?
“The world is now firmly in a third phase of Net Zero target—setting and implementation.”
— Net Zero Stocktake 20235
Committing To and Planning For Net Zero
In 2024, countries with Net Zero targets represented:

of the world’s population up from 52% in 2020.

of global GDP up from 17% in 2019 and 68% in 2020.

of global greenhouse gas emissions up from 61% in 2020.

of global greenhouse gas emissions are also now covered by a Net Zero target that is formalized into law or official policies.
The world is clearly on board with addressing climate change. The intent is there. We now need ‘all hands on deck’ action.
Note: The Net Zero Tracker (used to create the Net Zero stocktake reports) is the most comprehensive and up-to-date database of Net Zero commitments made by nations, states & regions, cities and major companies. It includes:
• all UNFCCC member states and a selected number of territories (including the world’s biggest carbon polluters — China, US, India and the EU);
• subnational states & regions in the 25 largest emitting countries;
• all cities around the world with populations over 500,000;
• publicly-traded companies that were listed in the Forbes Global 2000 in 2020
• 100 of the world’s largest private companies.
Overall, 43% of 4069 entities (excluding private companies) that are monitored in the Net Zero Tracker database have Net Zero targets or similar pledges as of 2024.

The UN Race to Zero initiative lists >11,000 companies, >1000 cities, over 1000 educational institutions, and >600 financial institutions and more, all pledging to take rigorous, immediate action to halve global emissions by 2030 (based on the fact that the interim target accepted as required for Net Zero 2050 is a 45% reduction by 2030.)
The Climate Registry also maintains a searchable Net Zero portal for North American companies.
Finally, UNFCCC Net Zero data public utility tracking company Net Zero action data repository — has almost 400 members.
Other coalitions and registries track additional broad commitment to climate action — even though all goals are not directly tied to Net Zero targets.
Amazon climate pledge signatories has >500 corporate signatories representing almost 10 million employees across 45 countries.
UNFCCC interactive database of public and private sector entities committing to climate action with almost 40,000 participants. You can search for companies, investors, organizations, regions and cities across the globe and review participating entities’ commitments and progress.
From Pledges and Plans to Credible Action
Making a pledge, although an important acknowledgment of the climate crisis and mitigation targets, is the easy part. It can take some research to know whether an entity is committed and following through on climate action (ie. delivering with integrity) or greenwashing7 for the purposes of marketing or delaying emissions reduction. Third party certifications, science-based coalitions and new legislation around both carbon disclosure reporting and anti-greenwashing, such as the examples referenced in this website, can help you identify sincere intent and meaningful action. Where is your company/organization on the path to Net Zero?

• Publicly committing to Net Zero.
• Setting goals that include interim reduction targets such as 45% reduction by 2030.
• Not depending on carbon offsets to reach interim targets, Net Zero, or to claim neutrality (though using credible offsets along the way can help to account for interim carbon footprints).
• Creating a credible transition plan with buy-in and ownership from relevant parties.
• Phasing out fossil fuels and scaling up renewable energy.
• Aligning lobbying and advocacy to support the transition.
• Transparent reporting and accountability.
• Investing in socially and ecologically just transitions.
• Supporting a regulatory framework that drives the transition.

Some Key Drivers of Change

Legislation and Policies
Many governments that are part of the UNFCCC submit nationally determined contribution (NDC) reports and National Inventory Reports/Documents (NIRs/NIDs) on their GHG emissions and their plans to reduce them (see above.)
These reports are country level climate action plans and emissions reports that transparently track our collective progress to Net Zero. Starting in 2024, they will also include actions taken and how they relate to emissions targets.

Country level action plans include legislative commitments to targets but also supporting policies, laws, standards and guidelines that facilitate the energy transition and other GHG reduction initiatives.
Globally, the proportion of emissions covered in legislation or policy documents tied to Net Zero targets increased from 7% in 2020 to 75% in 2023. More than 70 countries now have Net Zero targets enshrined in legislation or included as a goal in policy documents5.
We, along with other countries, have many other related and relevant laws and policies that support the Net Zero transition as well. Many are new and have not been fully implemented yet.
In fact, there are a multitude of laws and policies coming from all levels of government all over the world. This resource provides a wealth of examples in a searchable database.

The positive impact of legislation in reducing emissions is discussed in these articles:
And a 2024 study reviewing about 1500 climate policy measures implemented over the last 2 decades across 41 countries revealed that 70% of large drops in emissions resulted from the co-implementation of 2 or more policies together and that in multiple sectors, pricing policies, such as subsidy reform in the energy sector and carbon taxes, were highly effective in reducing emissions.
The positive impacts of government action are obviously welcomed and inspire hope. If we support their successful implementation along with additional proposed policies, we have a chance of changing our trajectory and providing a better future for our children.
Some broad examples that are directly relevant for citizens include:
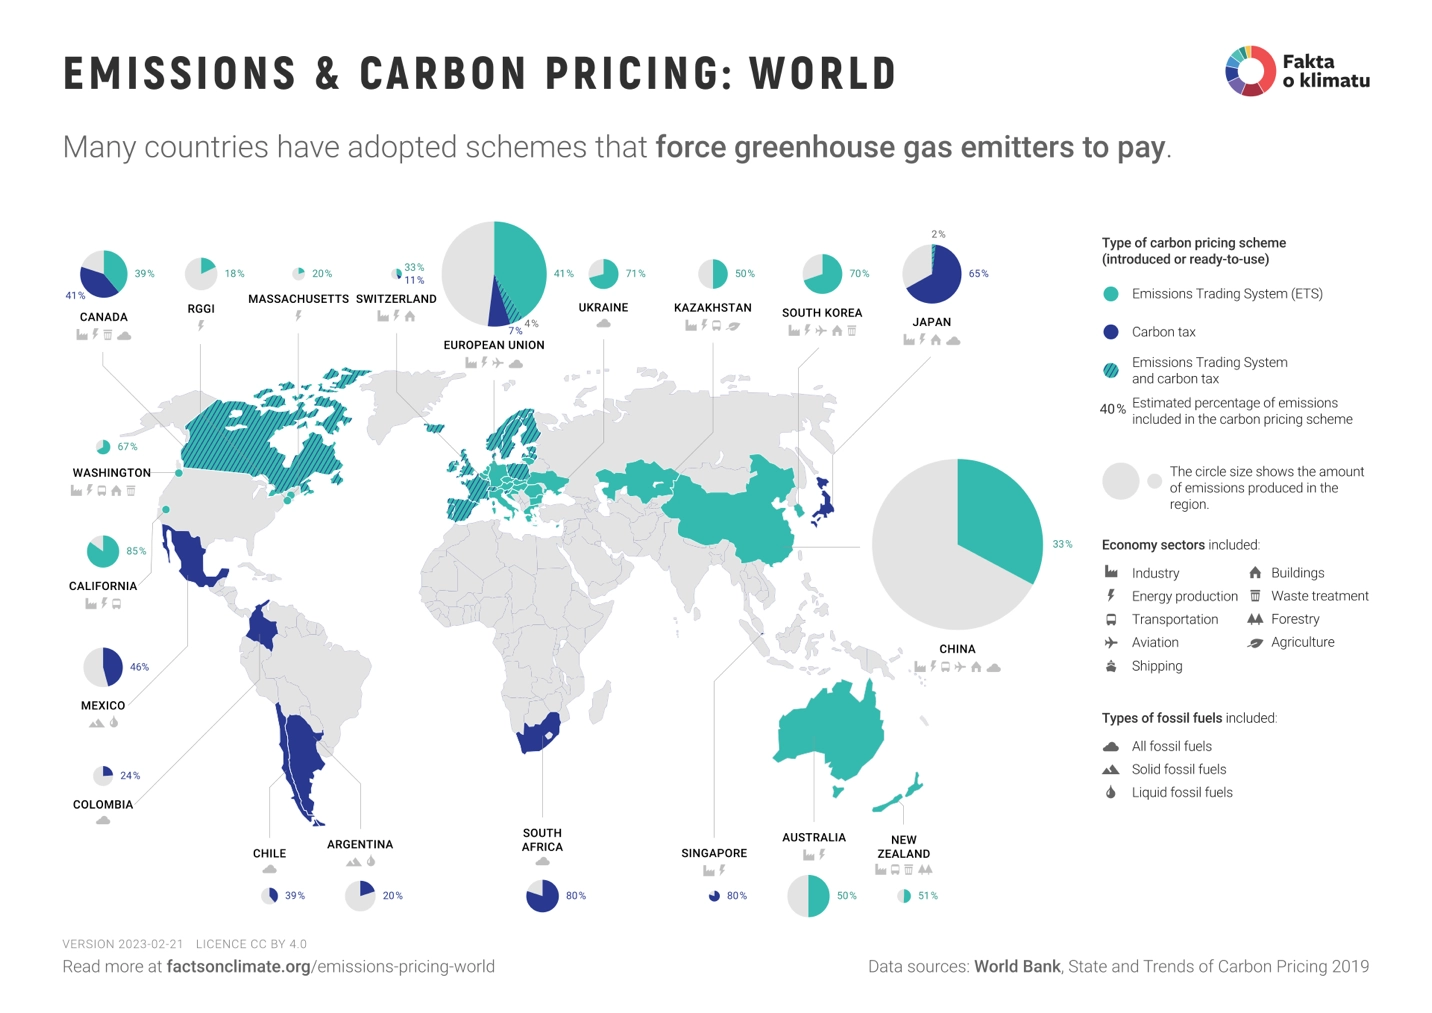
As of 2023, there were 73 jurisdictions (39 national and 33 subnational) that had carbon pricing in place, up from 64 in 20218. Canada’s can be found here.

Some examples of the types of carbon pricing can be found below:
Note: One major impediment to legislation restricting fossil fuel expansion is that many countries are subject to older international trade agreements that can still govern current trade arrangements and that have allowed fossil fuel companies to sue governments for loss of profits if they alter their policies to address climate change in a way that impacts the companies’ growth
In Canada, NAFTA rules allowed Quebec to be sued by fossil fuel companies when it changed its climate policies, even though the mechanism that allowed them to sue was removed in NAFTAs 2018 replacement (USMCA.)
Similar disputes are occurring elsewhere as well.
35 countries have implemented or are implementing mandatory environmental disclosures including climate risk as of 2023. Canada is among them with legislation coming into effect in 2025.9
These regulatory changes will put almost half of global GDP and global emissions under disclosure rules, rising to two-thirds if similar proposals go through in the US (as proposed.)
The UK and Spain are also implementing mandatory Net Zero emissions plans for corporations. In June 2023, the European Parliament supported inclusion of a provision in its Corporate Sustainability Due Diligence Directive mandating companies to have transition plans commensurate with a science-based 1.5°C Net Zero pathway5.
There are many reasons that mandatory emissions and (physical and transition) climate risk disclosure rules are important. Central banks, the insurance industry and the investment industry, for example, need to assess, anticipate and mitigate risks to the economy and to specific economic sectors.
Key low emissions power policies were introduced in 2022/2023 in the United States, China, Europe, Indonesia and Southeast Asia, India, Japan, Korea, South Africa, and Brazil.5
Some Canadian renewable energy policies and laws:
Canada EV mandates (very much aligned to those of other countries):
Note: policies that have been introduced in the last few years can be delayed for years by implementation obstacles (for example, permit approvals can take years, grid upgrades are required in many places before the transition to renewables and electrification of heating can be supported, skilled labour trained in new technologies can be a bottleneck.)

In the United States (California): California enacts anti-greenwashing requirements

Many countries are phasing out fossil fuel heating of buildings. Learn more about when and how here.

In the United States: Gas Ban Monitor: Denver tackles retrofits; Pacific Northwest movement grows
Although opposition to this movement may pre-empt additional cities from moving forward as well with some States pre-emptively passing laws that prohibit gas bans.
See just a few examples below:

Financing the Transition
Investing in the energy transition away from fossil fuels to low/no carbon sources of energy usually refers to investments in the following technologies:

Renewable Energy Like Wind and Solar

Energy Storage

Nuclear Power

Green Hydrogen

Carbon capture and storage

Electrified Transportation

Electrified Heat

Sustainable Materials
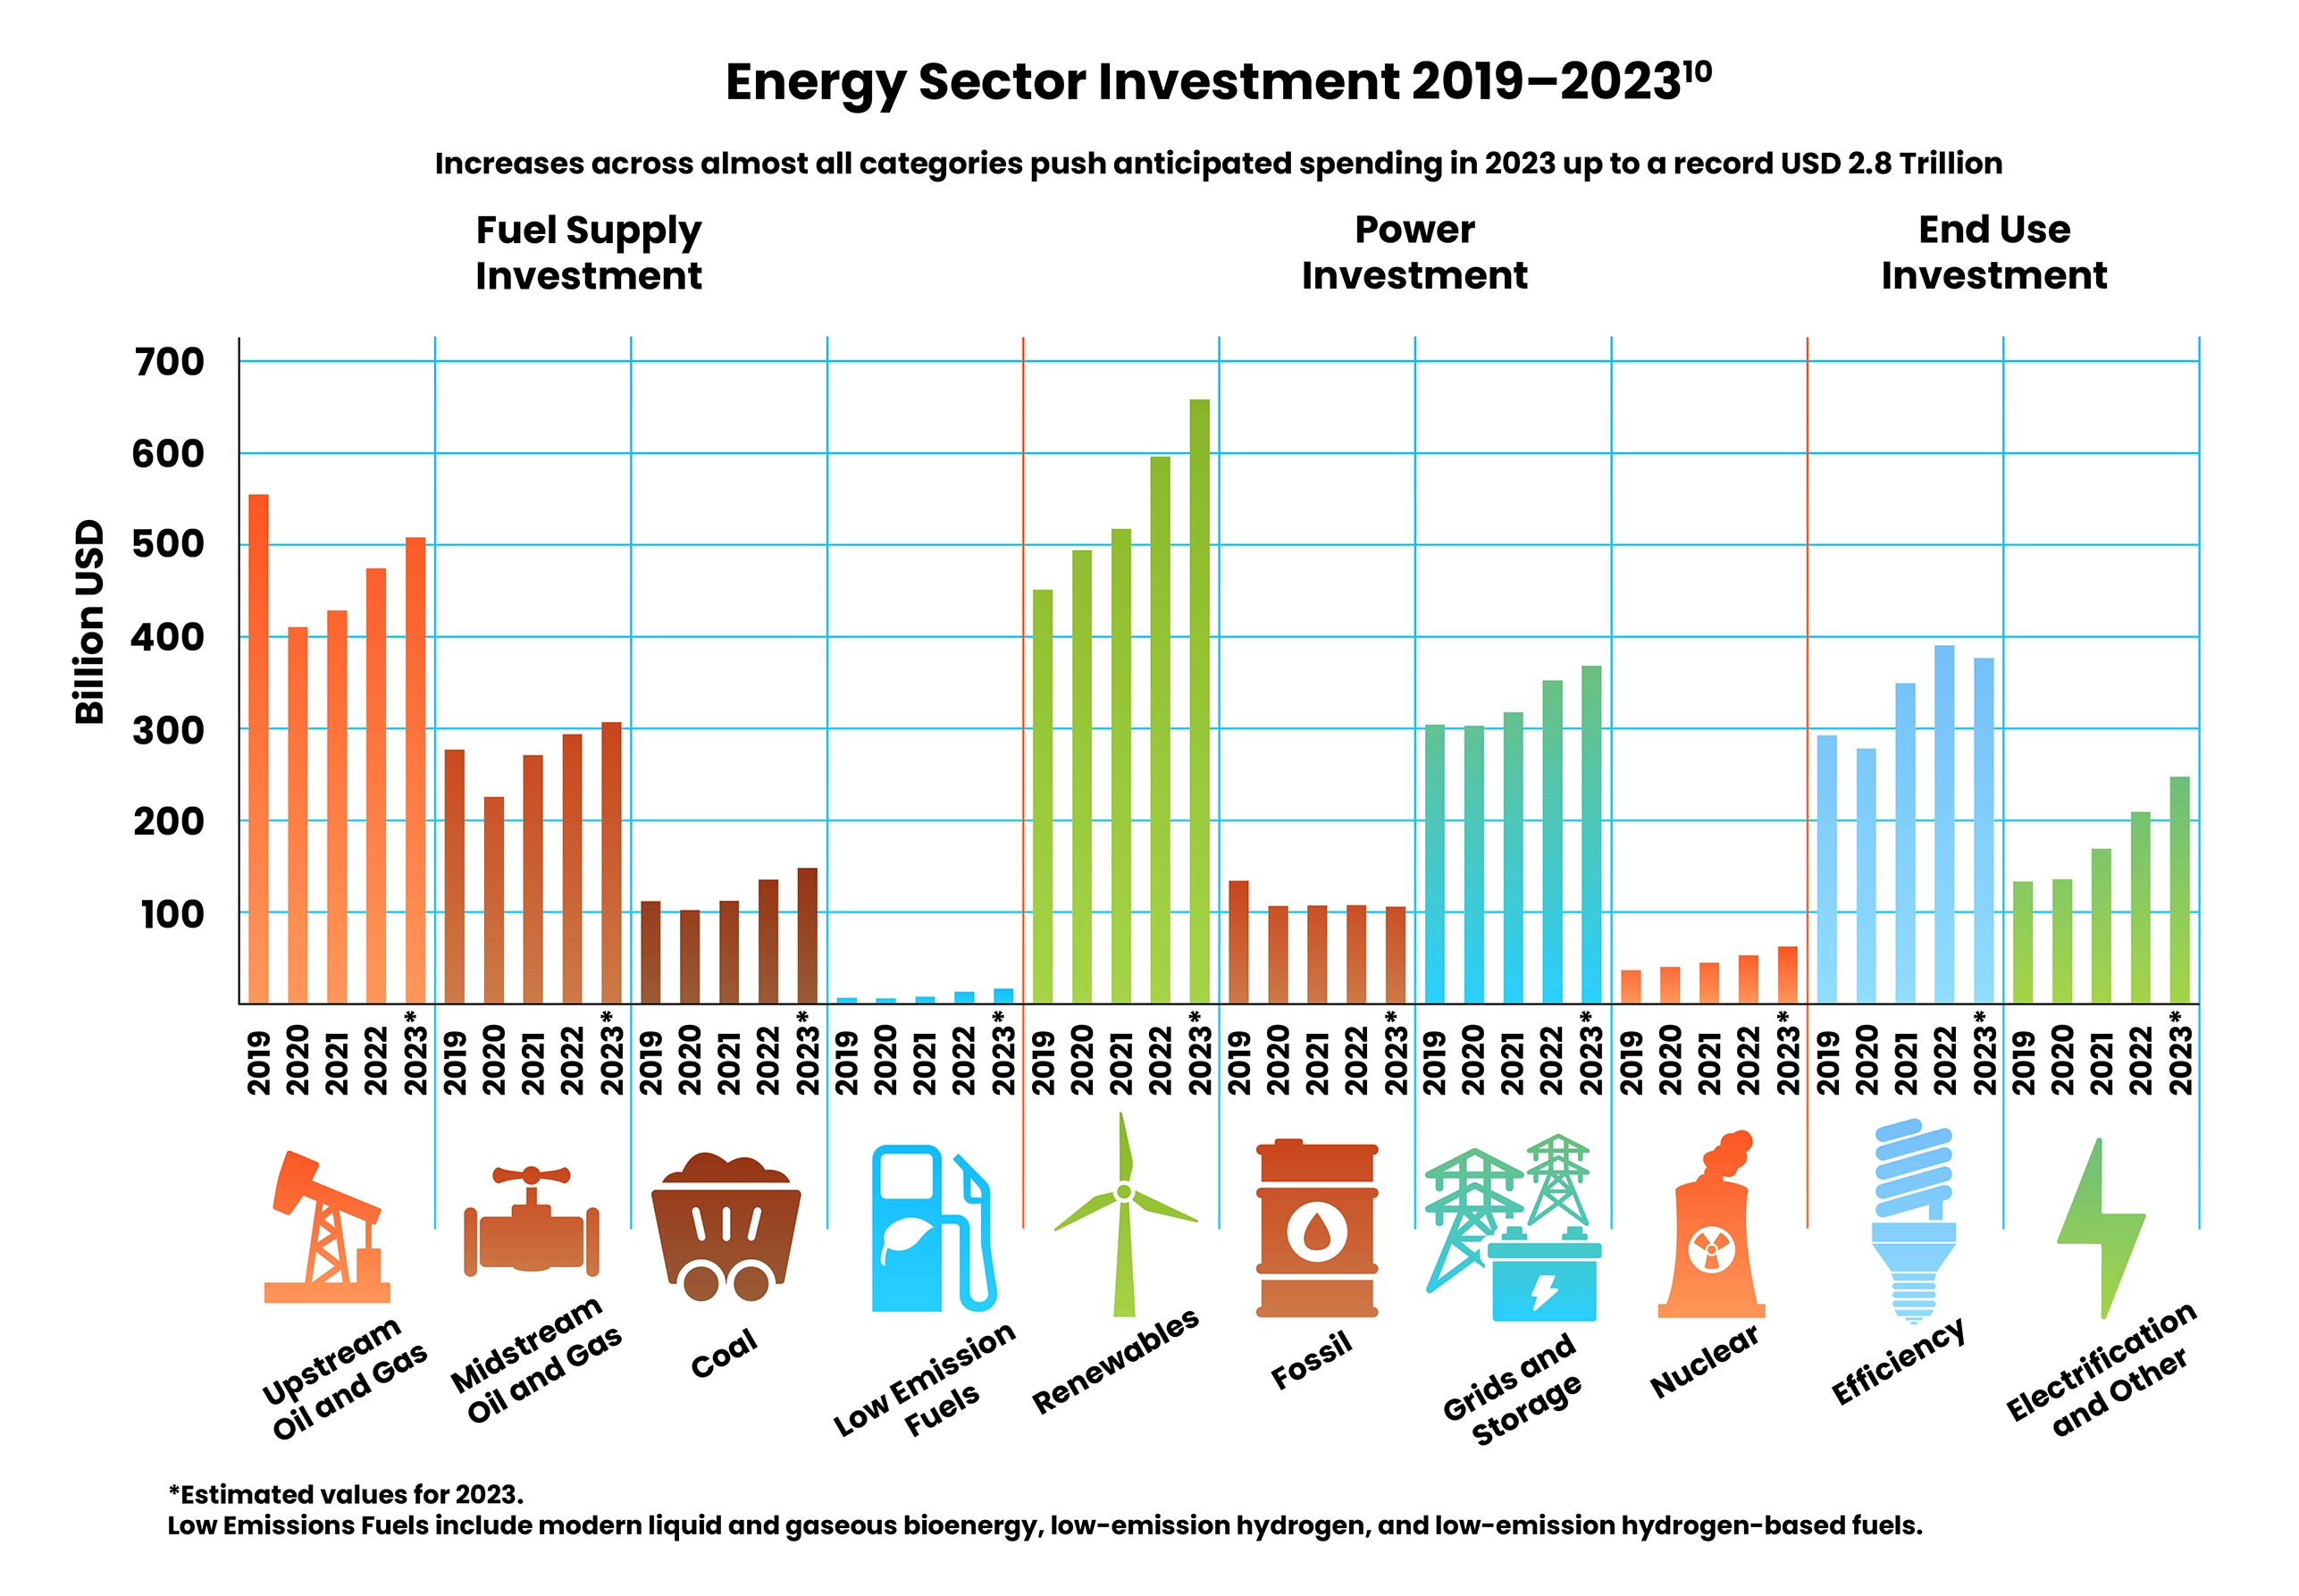
According to the International Energy Agency’s World Energy Investment 2023 (WEI 2023) report, the last few years have been a period of “extreme disruption for the energy sector”10
The investments in electrical grids, grid battery storage, and renewables (primarily utility scale solar) are encouraging and will drive the shift to clean energy and electrification required to transition away from fossil fuels.
The world has also seen improvements in energy efficiency investments and significant investment in electrification of cars and other clean technologies.
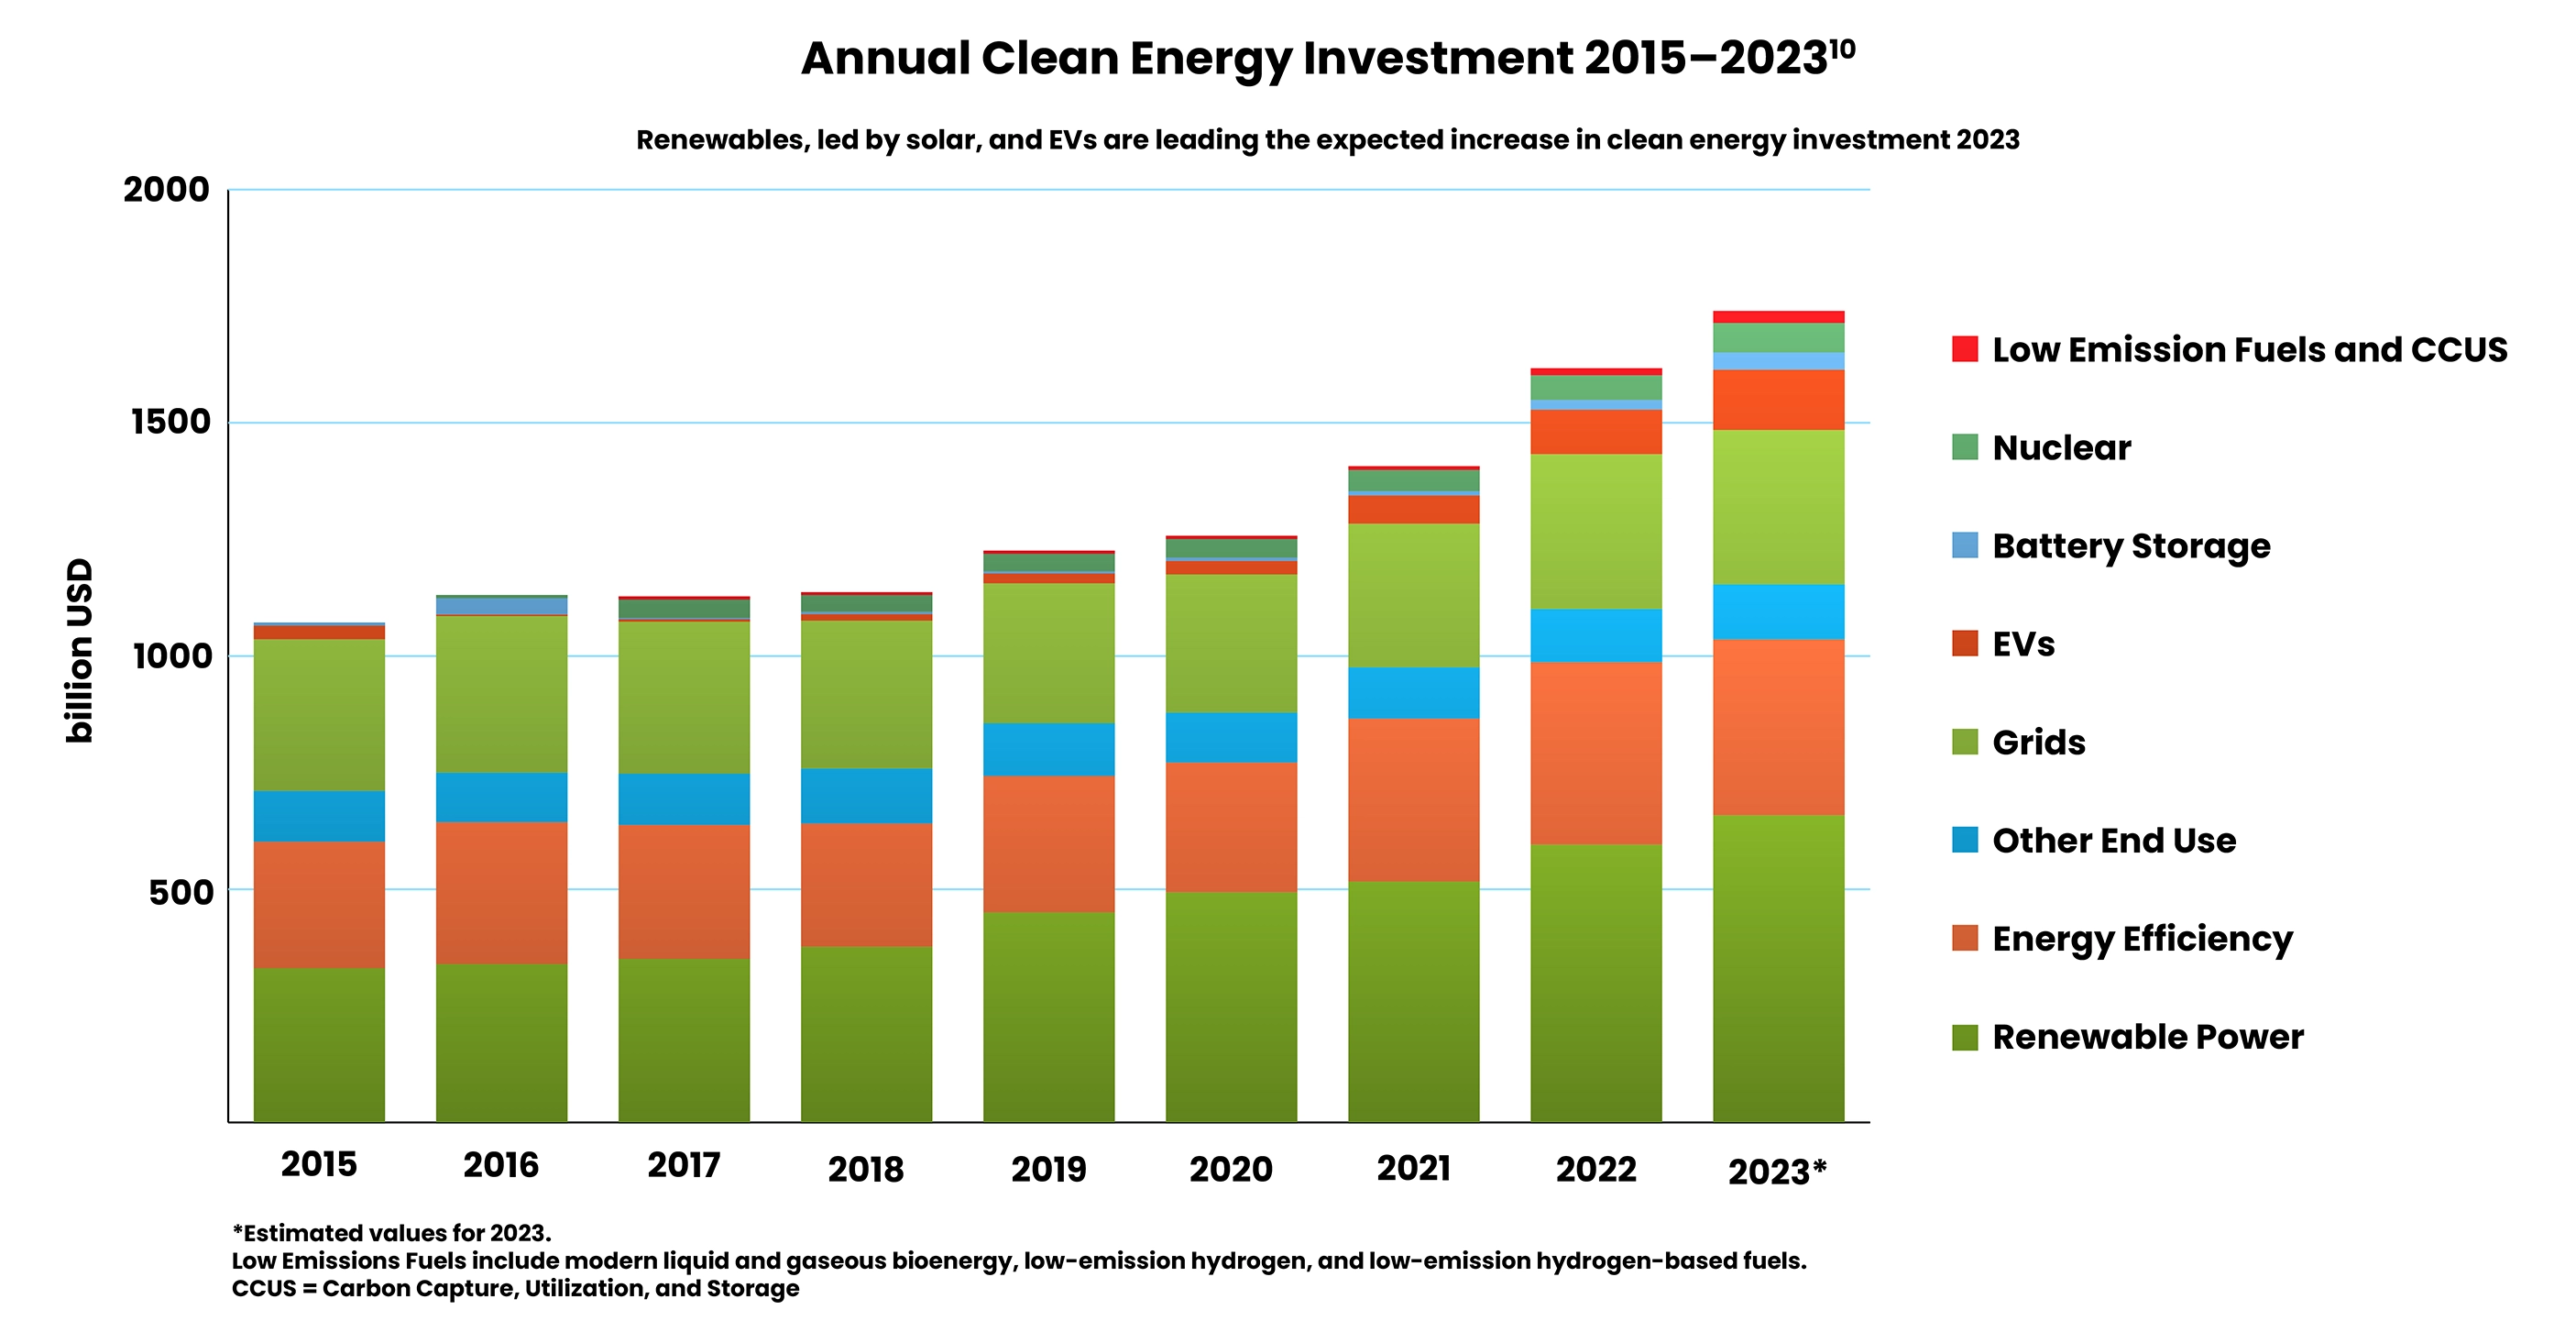
1.7:1 — the investment ratio for clean energy: unabated fossil fuel supply and power.10
Note: clean energy includes renewable power, nuclear, grids, storage, low-emissions fuels, efficiency improvements and end-use renewables and electrification. For EVs — this means the incremental spending on EVs above the average price of a vehicle. For fossil fuels, 15% is investment in coal, while 85% is investment in oil and gas.

1 billion per day — Investment in solar in 2022 (greater than oil’s capex7)
70% YOY increase — solar PV capacity in China, 2022
40% YOY increase — solar PV capacity in Brazil, India and Europe, 2022
90% — percent of capital flows in the electricity sector going to renewables in 2023
$546 billion — energy transition investment in China, 2021 (almost 50% of the global investment that year)
$141 billion — transition investment in the US in 2022 (and rapid acceleration anticipated due to Inflation Reduction Act)
$180 billion — energy transition investments in Europe in 2022
This is good news. However, the energy transition and grid investment need to average $4.55 trillion between 2023 and 2030 to meet Net Zero 2050 goals, particularly in the areas of electrified transport, renewable energy and grids. There is still a significant finance gap for the energy transition in most areas.14
Significant investment in fossil fuel (FF) projects, including for new FF projects, is also increasing.11 However there are some good indicators on that front as well. In 2023, for the first time, company and government bonds for environmentally friendly projects (Green bonds) exceeded those for fossil fuels.12 We are also increasing divestment of fossil fuels in pensions and other funds.13
The scales are tipping away from fossil fuels in favour of clean energy.
What Have We Achieved So Far With These Policies and Financing, Innovations, and Corporate Commitments?
Clean Energy Production
38.5% of world’s electricity supply in 2022 (including renewables like wind, solar, geothermal, hydropower and others plus nuclear) and >48% the projected percent of global electricity that will be powered by renewables in 2027. In 2022, the growth rate for renewables based electricity production was 15% compared with a 0.4% growth rate for fossil fuel based electricity.15

90% — amount of new electricity demand covered by clean energy sources between 2022 and 2025.
4500 Gigawatts — the projected global renewable electricity capacity for 2024 (equal to the total power output of the United States and China combined.18)
51% — China’s installed capacity of electricity from renewables in 202319 (China is the world leader in solar production) and 33% — the projected shift in consumption of renewable electricity by 2025.20
“…we are close to a tipping point for power sector emissions.”
— Fatih Birol, Executive Director, International Energy Agency17
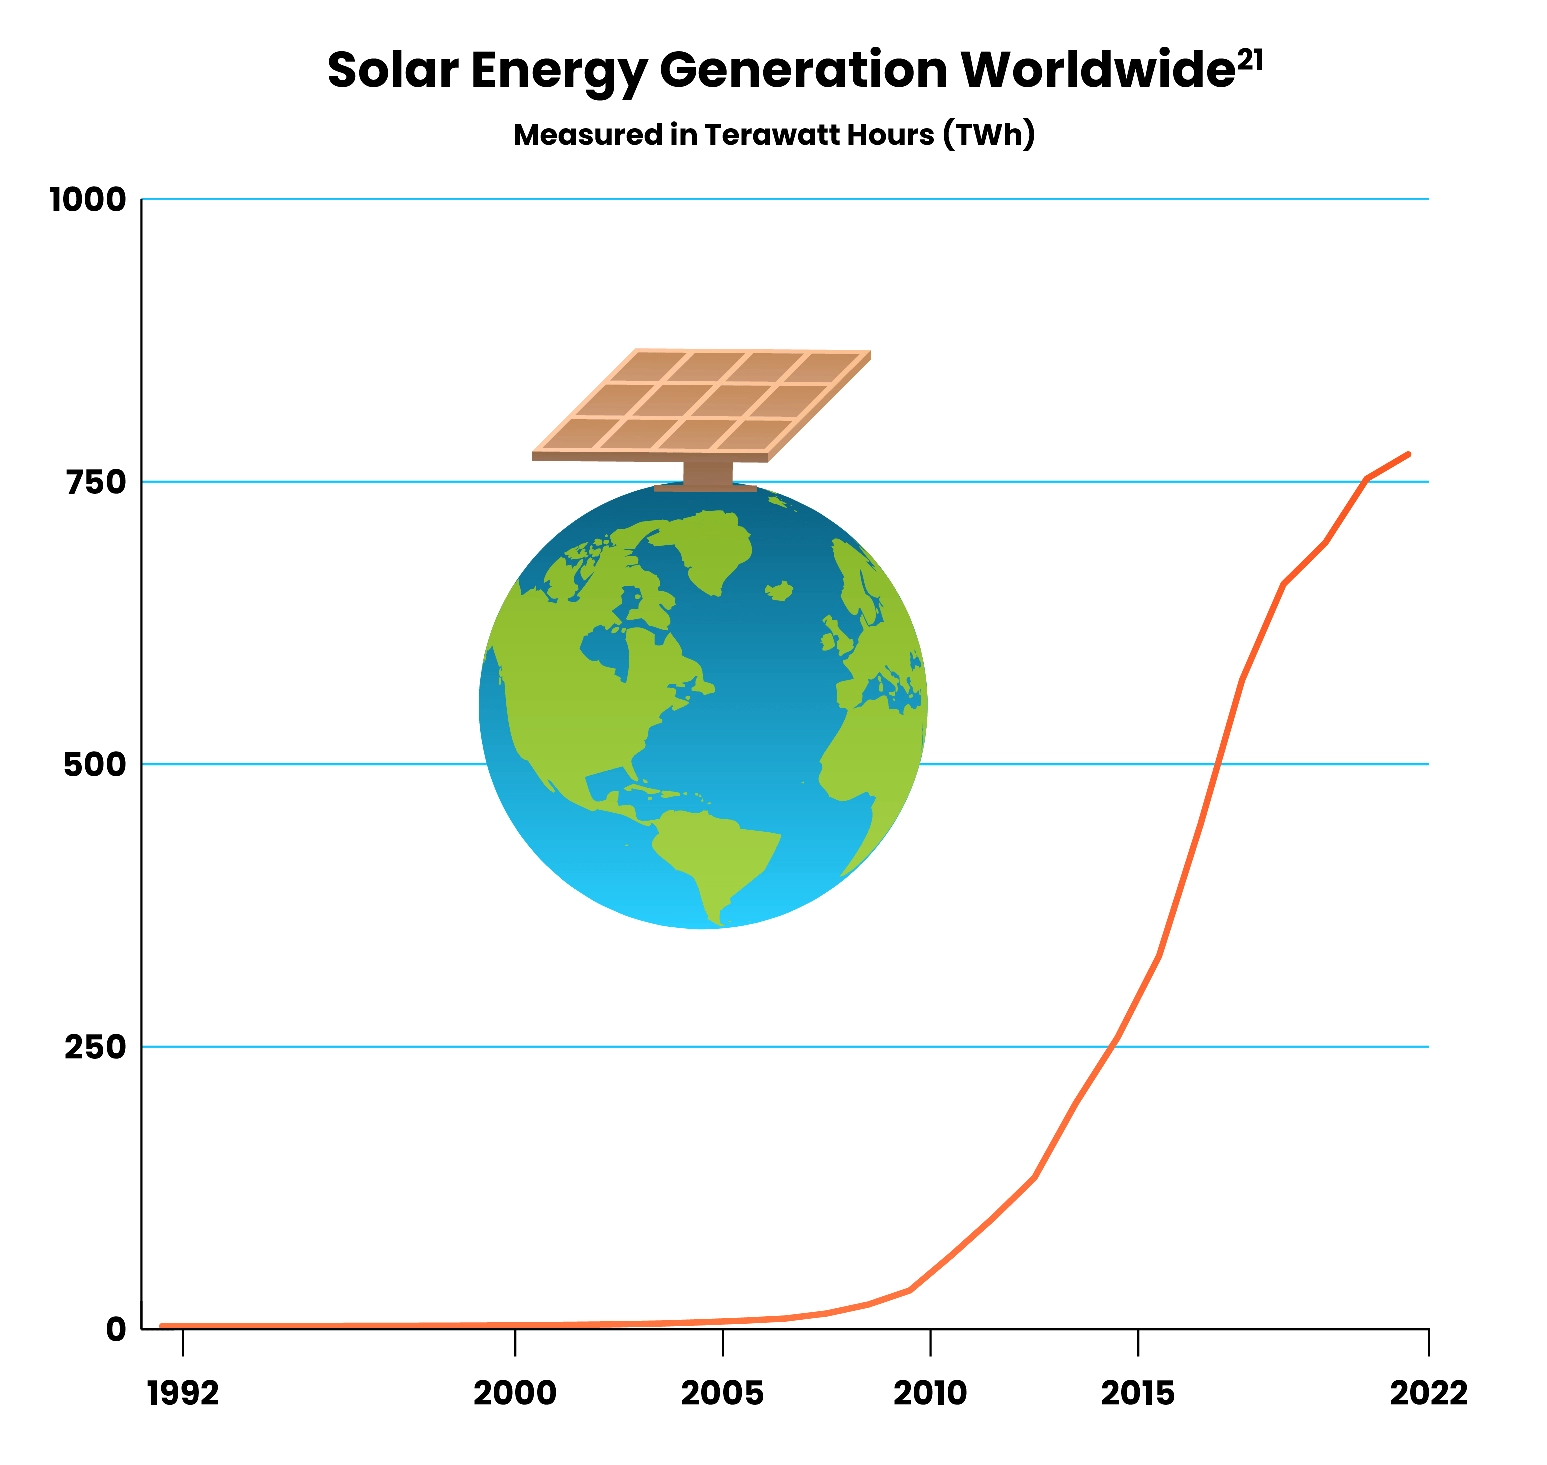
According to the International Energy Agency’s Net Zero 2050 scenario tracker, the annual growth in solar PV (26% in 2022), is now aligned with the growth rate needed this decade to reach Net Zero 205020.
Solar electricity capacity has hit an exponential growth curve.
Other Renewable/Clean Technologies
Implementation of other renewables is also growing but is not yet on track for Net Zero 205022 as per IEA projections. For example, wind energy is also expected to see acceleration in the next decade23. The IEA is projecting global wind capacity to double in the 5 years up to 2027, particularly via expansion of off-shore wind projects particularly in China and the United States22.
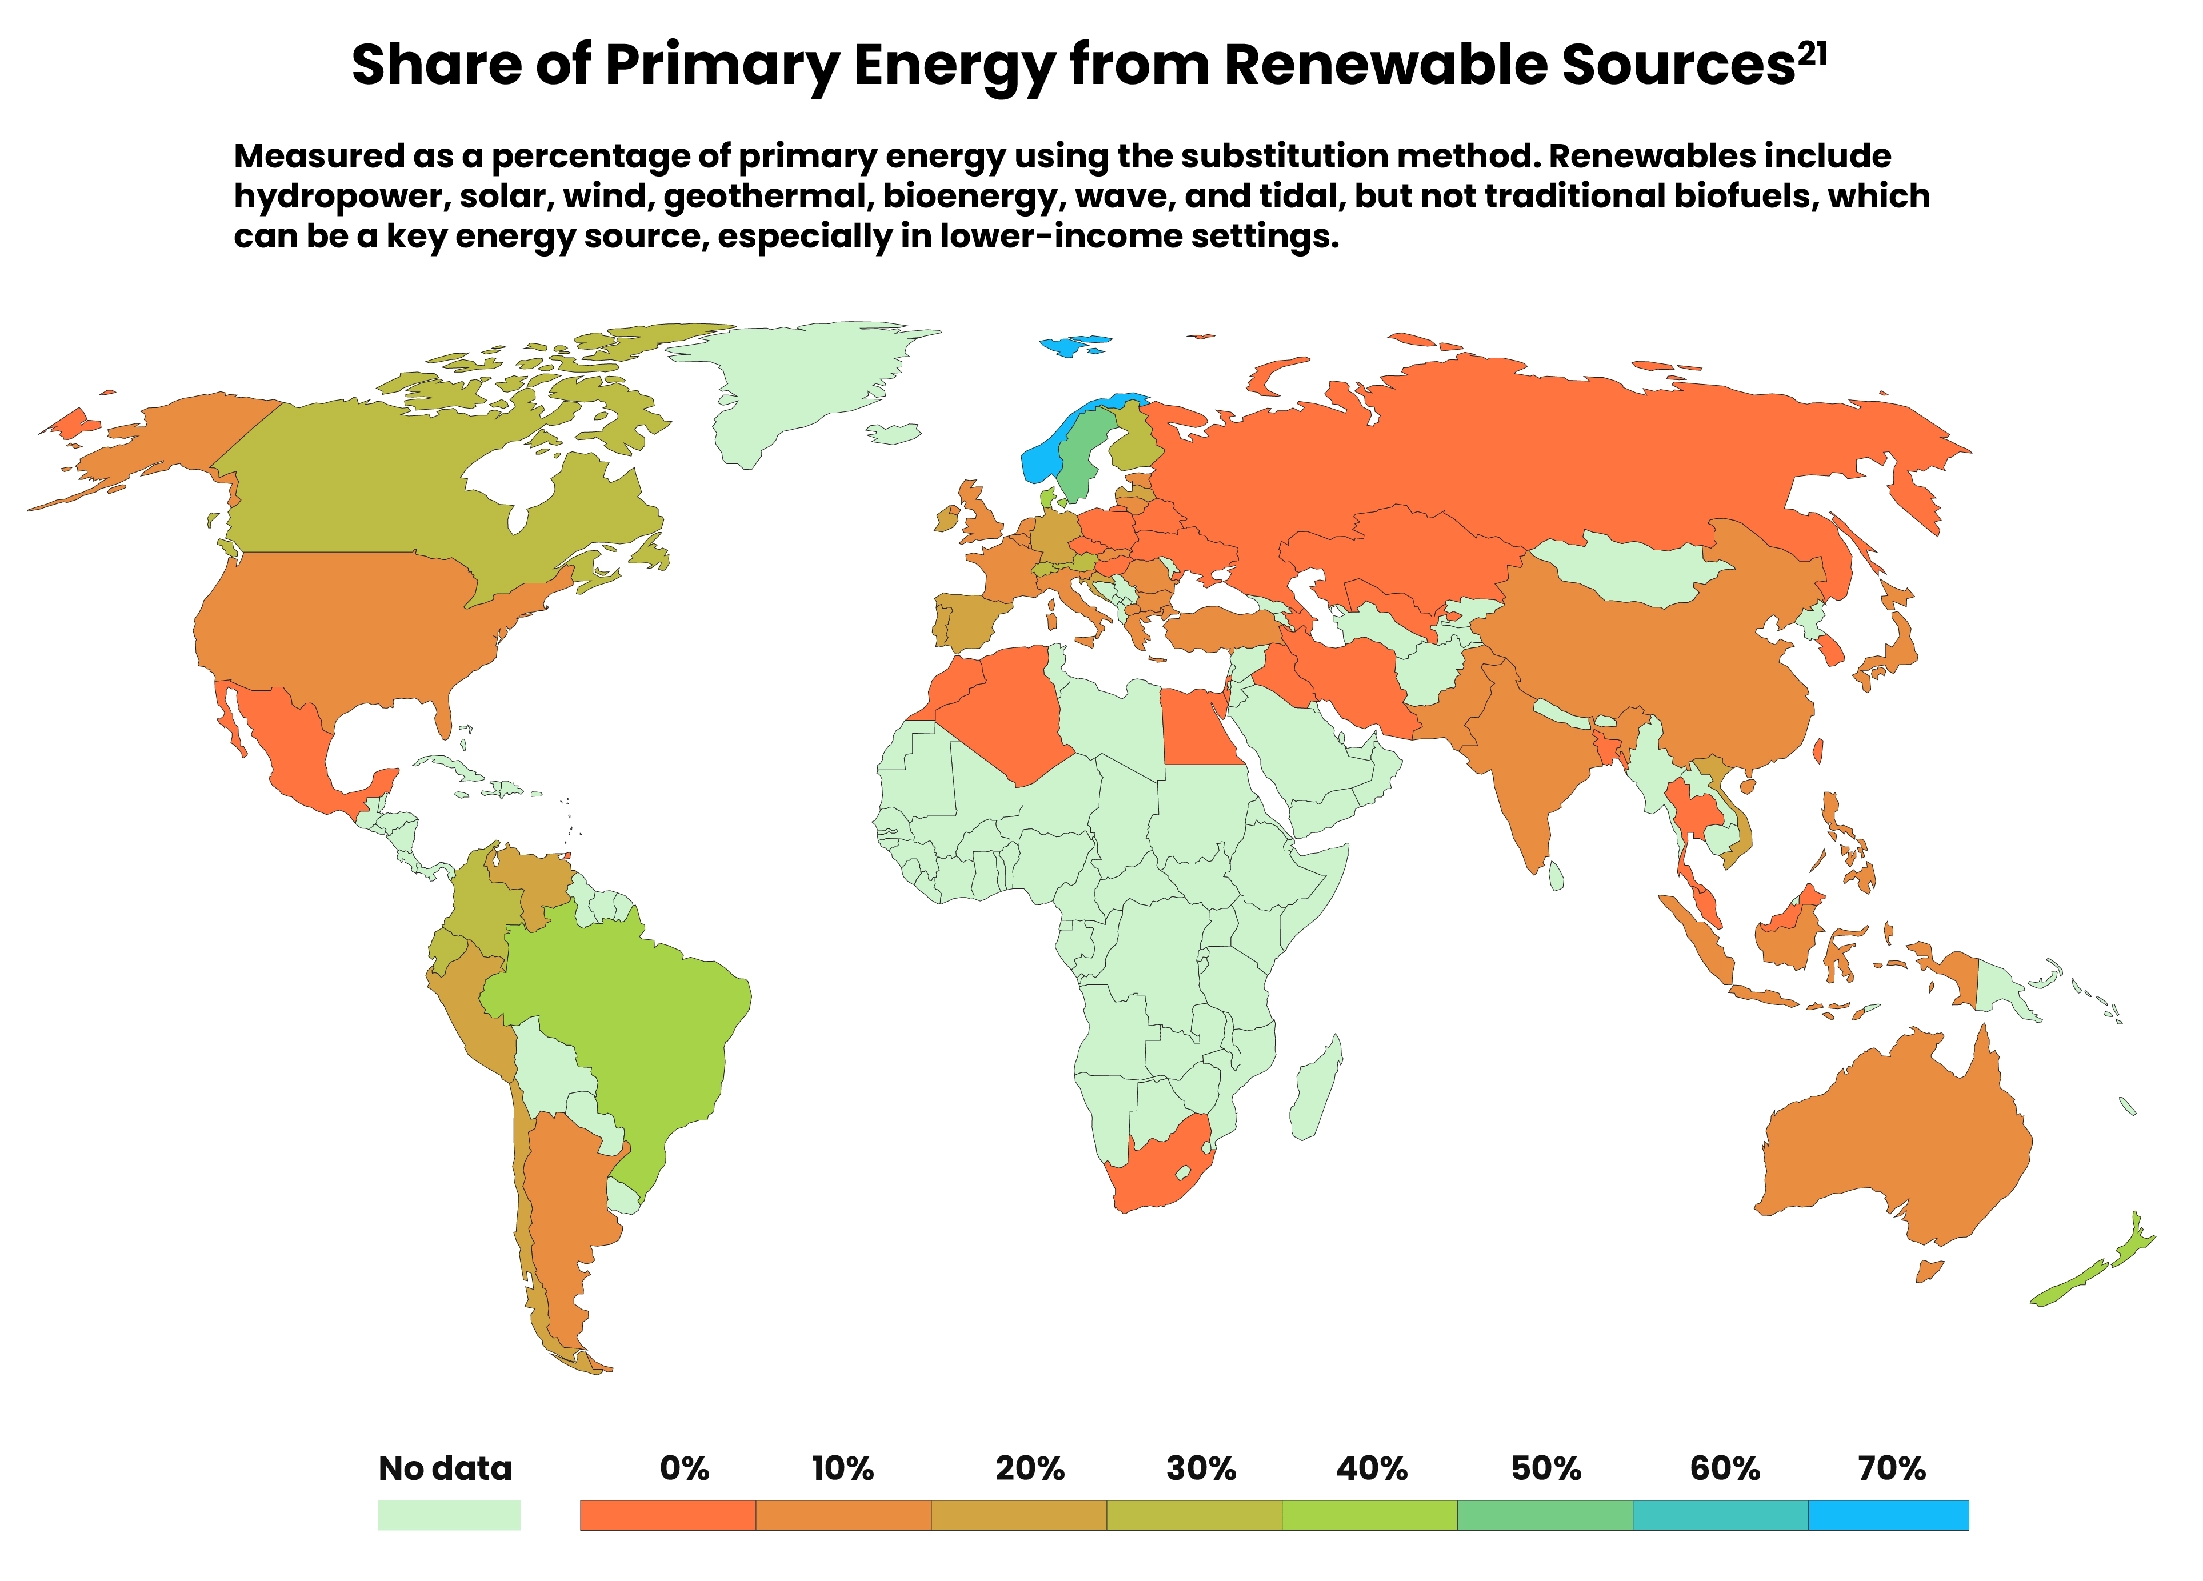
The IEA now predicts that renewable capacity expansion between 2022 and 2027 will reflect an 85% acceleration from that seen between 2016 and 2021, mainly driven by China, the EU, the United States and India due to implementation of new and existing policies as well as regulatory and market reforms. China’s 14th 5-year plan, the EU’s REPowerEU and the US Inflation Reduction Act are key drivers.
But globally, we need to do even more to hit Net Zero 2050 targets.
Although Canada’s electricity grid largely uses renewable and nuclear energy, we still have fossil fuel-based electricity to phase out and we need to expand capacity to handle the transition to electrification. We need to vote in leaders that can lead us through the transition to clean, affordable and reliable energy with credibility and accountability.

Electric vehicles (EVs)
EVs have hit an adoption tipping point and EV sales are now growing exponentially. Globally, EV sales grew by more than 100%, between 2021 and 2023 reaching almost 14 million cars sold22.
Governments all across the globe have been putting EV policies and sales mandates in place (you can explore these in the link here) that will drive the transition to clean personal transportation over the next decade. Already, the announced manufacturing capacity for EV batteries is sufficient to fulfill anticipated demand in 2030, aligned with a Net Zero 2050 scenario22.

Heat pumps
Globally, heat pumps cover about 10% of global building heating needs as of 202327. However, heat pump adoption is accelerating with 11% growth in sales in 2023, which approaches the 15% compound annual growth rate (CAGR) needed to align with a Net Zero scenario22. Europe, China and the United States are leading the transition.

Green Hydrogen
Hydrogen energy is a promising key energy source, particularly for sectors that are hard to abate with electrification like commercial transportation. However, to be a scalable, sustainable solution, we need green hydrogen made using clean energy sources, not hydrogen made using fossil fuels.
Production of green hydrogen requires electrolyser technology and in the IEA’s Net Zero modelling, capacity would have to reach 550GW by 2030. Based on current projects in the pipeline, we are on track to reach only 170-365GW by 203020.
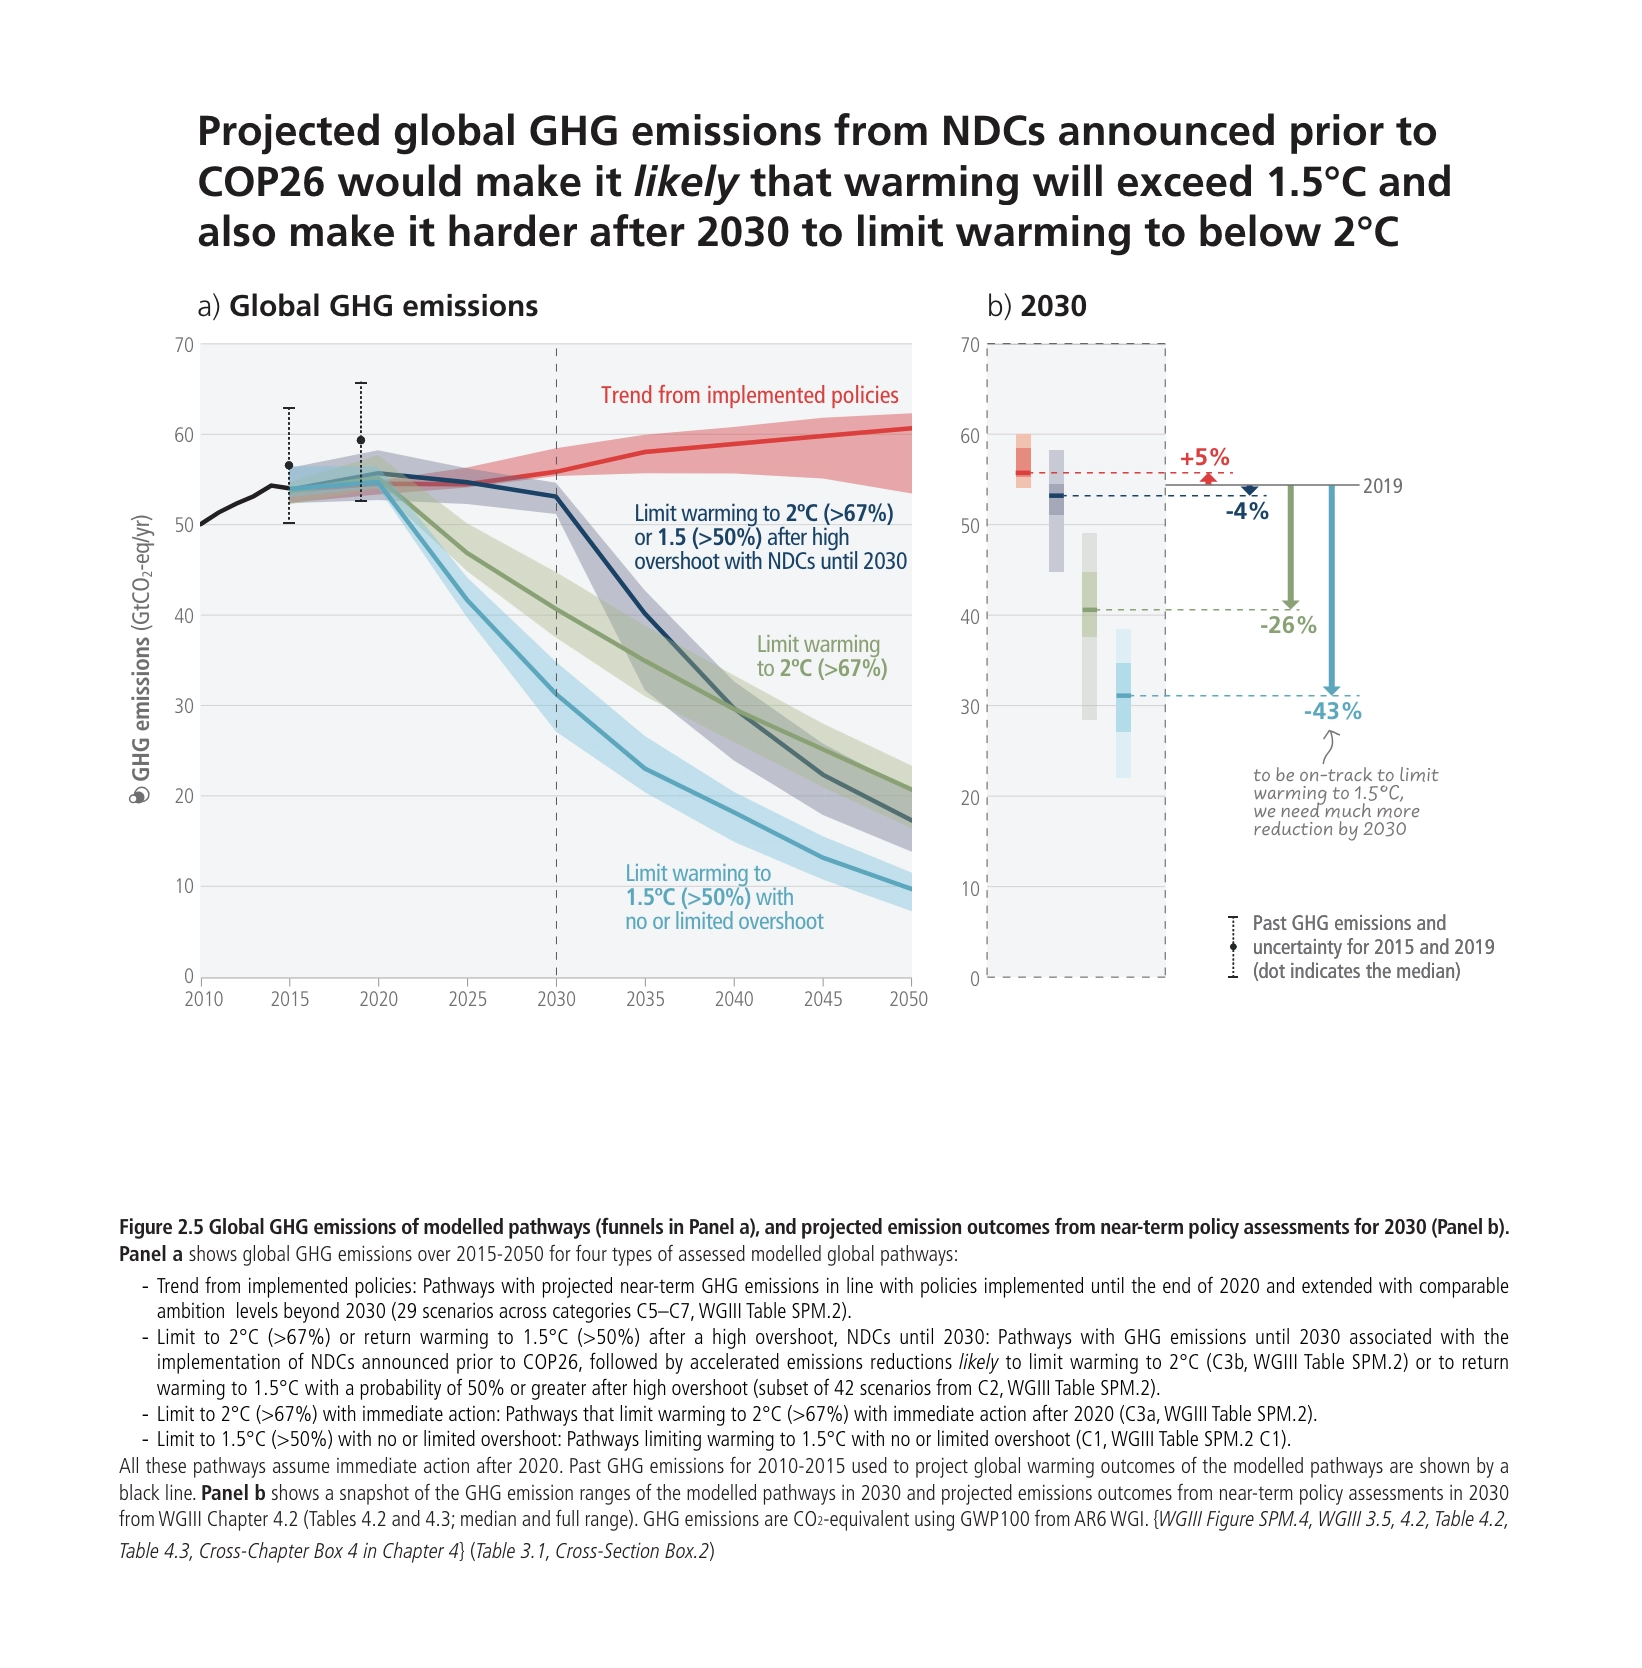
Although we are not on track for 1.5°C or even for 2°C yet, the pace of change in the last few years is cause for hope
Currently, we are still headed for about 3°C, but the tide is shifting and if the momentum continues and increases over the next 5 years, we still have time to limit warming to less than 2°C. Much progress has been made even in the last 12–24 months all around the globe. The tide is shifting.
From 2014 to 2023, global emissions grew more slowly than all prior decades since the 1920s.
2023 emissions from advanced economies (developed countries) fell to the lowest level since 1973. China (the largest global emitter of GHGs) is approaching its emissions tipping point – and will help supply other countries with low emissions technologies, accelerating the downward trend.28
According to the IEA, we are on track to see all three fossil fuels peak before 2030,29 with emissions peaking in most advanced and large emerging economies by 2030 as well (see predicted peak emissions by country here.)
The wide range of government policies around the globe and emerging private sector standards and accountability will steer us towards a clean economy, though global conflicts, economic stress, political uncertainty, and the rise of energy intensive technologies such as AI and cryptocurrencies threaten progress.28
Citizens can play a critical role in driving change through shifting social norms, being early adopters of the clean energy transition and by supporting government and business action using their voices, votes, and consumption behaviours.
Globally, citizens agree that governments, businesses, and citizens all need to do more. Let’s bridge the gap between intention and concrete action.
In a 2024 UN survey, 84% of people said their country should strengthen its commitments to address climate change and an additional 10% said that their countries should stay the course. Few people want less action.30
Here are some resources to explore that track how the world is progressing. Most allow you to look up specific countries so you can compare Canada’s progress against that of other countries. Many will let you know that we are not on track, but this picture is rapidly changing now and there is still hope if we act now. What these sources also show you is that there is a lot being done to get on track and that many of the initiatives you see in Canada (e.g. the carbon tax, clean energy targets and incentives, multiple climate change laws), are not isolated but rather are part of a large global effort, with a majority of countries moving in the same direction.
How is Canada doing now?

The news in Canada has improved significantly over the last couple of years.
Here is Canada’s December 2023 progress report, including our most recent efforts not yet reflected in other sites. Canada has implemented >140 climate measures over the last few years, covering a multitude of action areas across the whole economy.
And here is an independent assessment of this progress report that confirms that the governmental efforts including climate legislation, as well as announced plans and policies not yet in effect can bring us 85–90% of the way to our 2030 goal IF we all act as quickly as possible to help implement them.
Learn more about Canada’s plan and how your efforts are part of a sea of positive change in the Areas of Action section.
Other Good News
There is positive action happening in every area of climate change mitigation and adaptation all across the globe. Beyond the immense amount of innovation in all areas of the energy transition, there is heroic work being done to protect the Amazon rainforest, an immense amount of innovation in sustainable materials (including, in packaging and construction), advancements in Regenerative Agriculture and plant-based foods and so much more.
Some of these are touched upon in the areas of action sections of this site. The more we can support and not impede these initiatives the better off we will be. The next time you consider a burger, think about where it might have come from and whether you might be helping those that are working to protect the Amazon or those that are destroying it. It matters!
Last updated October 2024
References
1. IPCC. (n.d.). History of the IPCC. https://www.ipcc.ch/about/history/
2. United Nations Climate Change. (n.d.). What is the United Nations Framework Convention on Climate Change?. UNFCCC.int. https://UNFCCC.int/process-and-meetings/what-is-the-united-nations-framework-convention-on-climate-change
3. IPCC Reports. IPCC. (n.d.). https://www.ipcc.ch/reports/
4. United Nations Climate Change. (n.d.). United Nations Climate Change Decisions. UNFCCC.int. https://UNFCCC.int/decisions
5. Axelsson, K., Black, R., Chalkley, P., Hale, T., Hay, N., Hans, F., Hsu, A., Hyslop, C., Kuramochi, T., Lang, J., Lutz, N., McGivern, A., Mooldijk, S., Short, N., Smith, S., & Yeo, Z. Y. (2023, June). Net Zero Stocktake 2023 — Assessing the status and trends of Net Zero target setting across countries, sub-national governments and companies. https://ca1-nzt.edcdn.com/Reports/Net_Zero_Stocktake_2023.pdf
6. Deloitte. (2023). 2022 Deloitte CXO Sustainability Report. https://www.deloitte.com/global/en/issues/climate/deloitte-cxo-sustainability-report.html
7. “net zero greenwash”: The gap between corporate commitments and their policy engagement. InfluenceMap. (2023, November). https://influencemap.org/briefing/The-State-of-Net-Zero-Greenwash-24402
8. The World Bank. (2023). Carbon Pricing Dashboard — Up-to-date overview of carbon pricing initiatives. https://carbonpricingdashboard.worldbank.org/map_data
9. Jonson, E. (2023, November 2). The Complete Guide to National Climate-related disclosures. CarbonCloud. https://carboncloud.com/blog/mandatory-climate-disclosures/
10. IEA. (2023, May). World Energy Investment 2023. IEA. https://www.IEA.org/reports/world-energy-investment-2023
11. IMF. (2019, September 20). Fossil fuel subsidies. https://www.imf.org/en/Topics/climate-change/energy-subsidies
12. Quinson, T. (2023, July 5). Green bonds take big lead over fossil-fuel debt deals. Bloomberg News. https://www.bnnbloomberg.ca/green-bonds-take-big-lead-over-fossil-fuel-debt-deals-1.1941685
13. Divest Invest 2021. DivestInvest.org. (2021). https://divestinvest.org/
14. Solomon, M., Meattle, C., & Naran, B. (2023, September 25). How big is the Net Zero finance gap?. Climate Policy Initiative. https://www.climatepolicyinitiative.org/publication/how-big-is-the-net-zero-finance-gap/
15. Berlin, K., & Willey, F. (2023, August). Transitioning to the Clean Energy Grid: A Deep Dive into the Levelized Cost of Electricity. https://www.atlanticcouncil.org/wp-content/uploads/2023/08/Transitioning-to-the-Clean-Energy-Grid-A-Deep-Dive-into-the-Levelized-Cost-of-Electricity.pdf
16. IEA. (2023, February). Electricity market report 2023 – analysis. IEA. https://www.IEA.org/reports/electricity-market-report-2023
17. Elton, C. (2023, September 2). Renewable energy to become world’s top source of electricity by 2025. euronews.green. https://www.euronews.com/green/2023/02/09/tipping-point-renewable-energy-to-become-the-worlds-top-source-of-electricity-by-2025
18. Explore electricity, heat and transport data from Renewables 2022 and previous years. IEA. (2022, December 6). https://www.IEA.org/data-and-statistics/data-tools/renewables-data-explorer
19. Hayley, A. (2023, June 11). China’s installed non-fossil fuel electricity capacity exceeds 50% of total. Reuters. https://www.reuters.com/business/energy/chinas-installed-non-fossil-fuel-electricity-capacity-exceeds-50-total-2023-06-12/
20. Tracking clean energy progress 2023 – analysis. IEA. (2023, July). https://www.IEA.org/reports/tracking-clean-energy-progress-2023
21. Ritchie, H., Roser, M., & Rosado, P. (2023, December 28). Renewable energy. Our World in Data. https://ourworldindata.org/renewable-energy
22. Global EV Data explorer – data tools. IEA. (2024, April 23). https://www.IEA.org/data-and-statistics/data-tools/global-ev-data-explorer
23. The next phase of wind power growth in five charts. BloombergNEF. (2022, June 28). https://about.bnef.com/blog/the-next-phase-of-wind-power-growth-in-five-charts/
24. Renewable electricity – renewables 2022 – analysis. IEA. (2022). https://www.IEA.org/reports/renewables-2022/renewable-electricity
25. Levelized cost of energy by technology. Our World in Data. (2023). https://ourworldindata.org/grapher/levelized-cost-of-energy
26. Lee, H., & Romero, J. (2023). Climate Change 2023: Synthesis Report. Contribution of Working Groups I, II and III to the Sixth Assessment Report of the Intergovernmental Panel on Climate Change. https://www.ipcc.ch/report/ar6/syr/longer-report/
27. Mckay, B. (2024, March 15). Global Heat Pump Statistics. GreenMatch. https://www.greenmatch.co.uk/blog/global-heat-pump-statistics
28. NewClimate Institute, Oxford Net Zero, Energy and Climate Intelligence Unit and Data-Driven EnviroLab. (2024, September). Net Zero Stocktake 2024. Net Zero Tracker. https://ca1-nzt.edcdn.com/Reports/Net_Zero_Stocktake_2023.pdf?v=1689326892
29. International Energy Agency. (2023, October). World Energy Outlook 2023. IEA. https://IEA.blob.core.windows.net/assets/86ede39e-4436-42d7-ba2a-edf61467e070/WorldEnergyOutlook2023.pdf
30. The Peoples’ Climate Vote 2024. United Nations Development Protocol. (2024, June 20). https://www.undp.org/publications/peoples-climate-vote-2024


