Why So Urgent?
You are not alarmist if the facts are alarming. The risks due to climate change are alarming — but many are not foregone conclusions. We can tell the next generation and those already impacted today a far better story if we join and help those who are addressing the crisis — and don’t ignore or trivialize — the alarming facts. Every increment matters. We can and must turn things around.
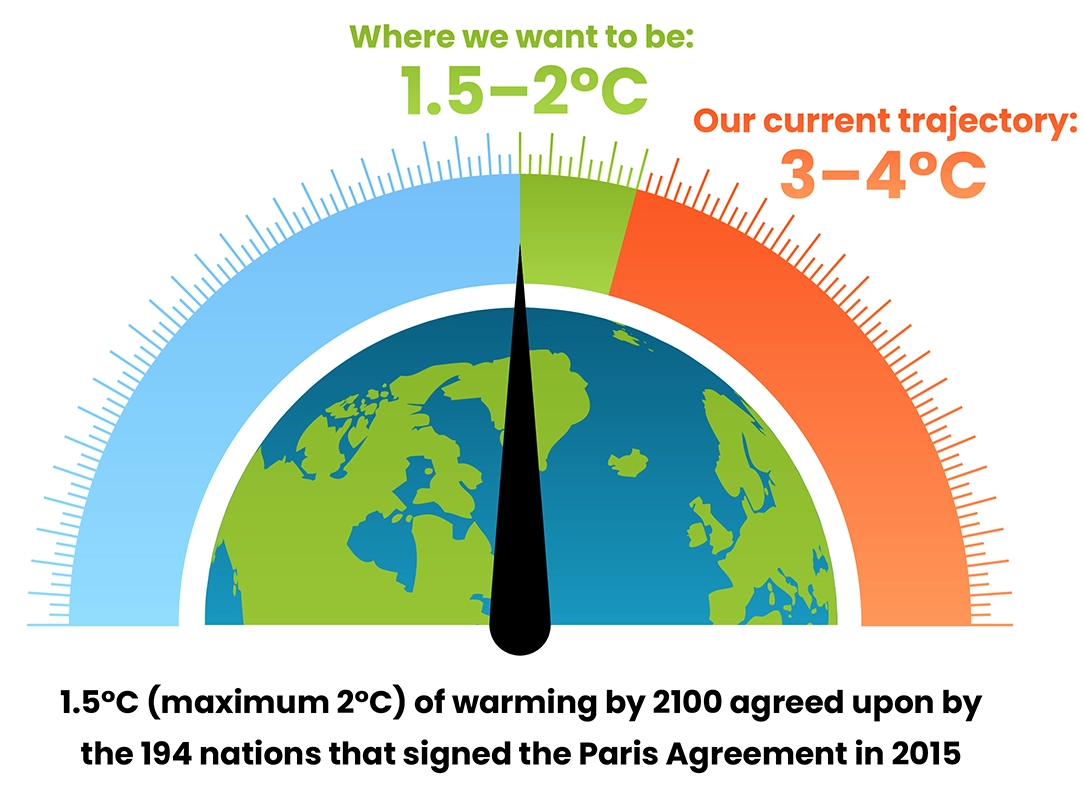
Fossil fuels and other sources of greenhouse gas emissions cause global warming, resulting in an increase in the likelihood, frequency, and/or severity of severe weather events and earth systems disruption, with massive implications for humans and other species.
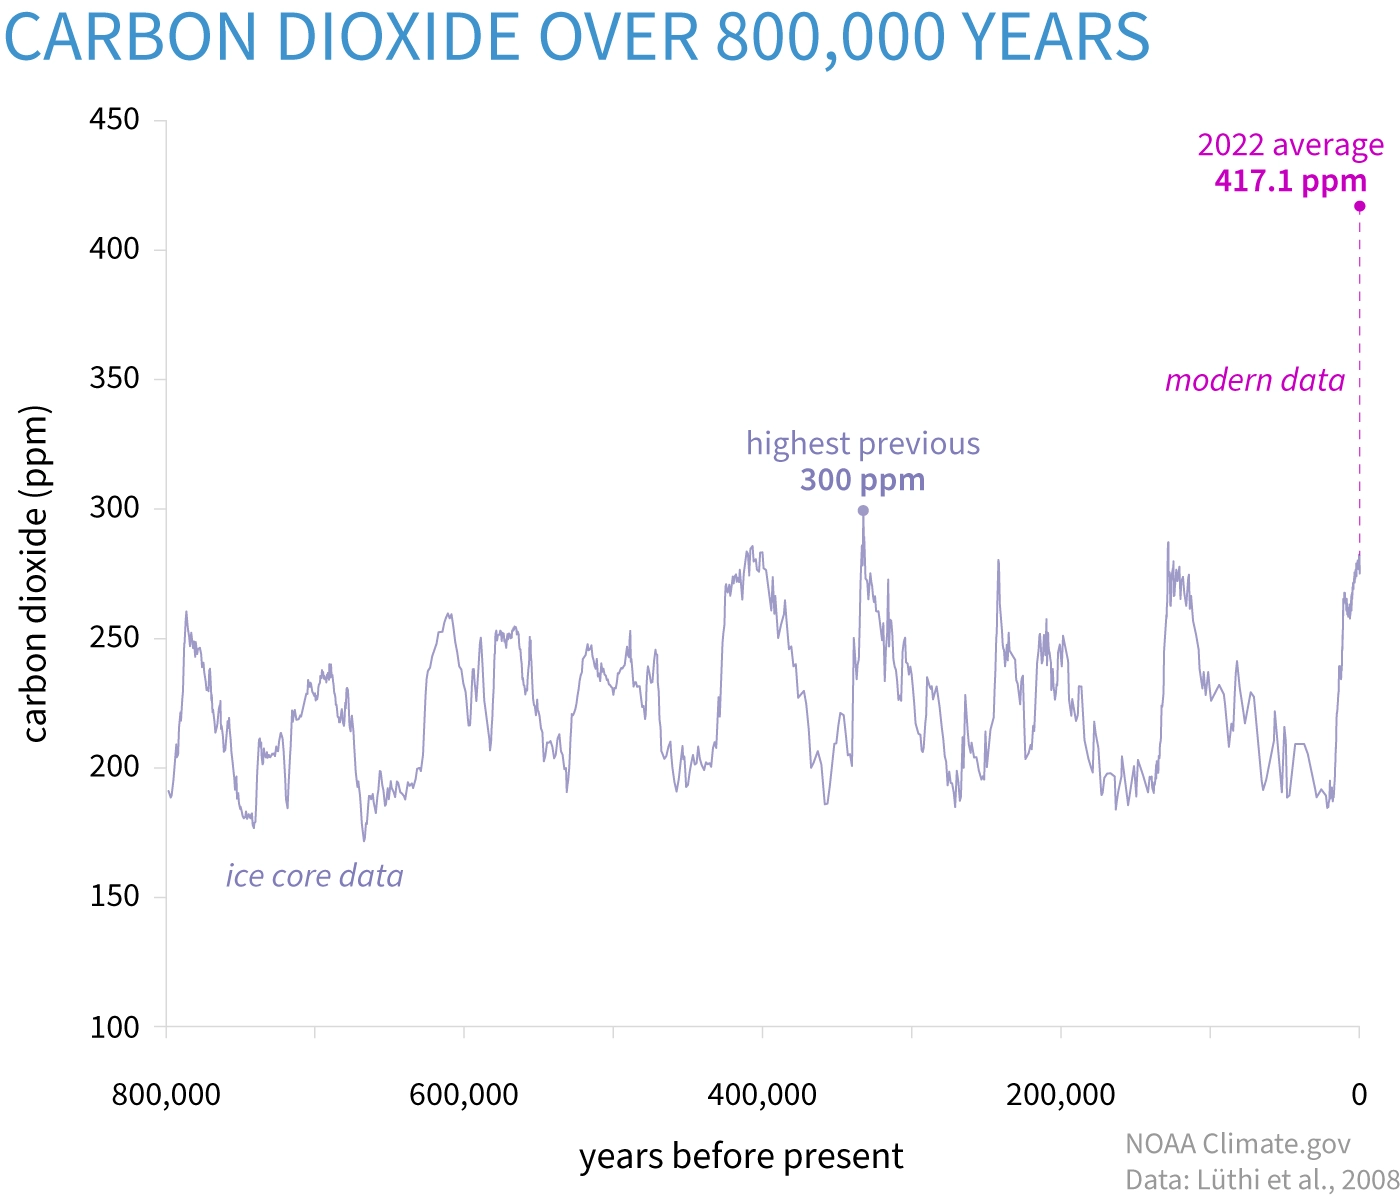
125,000 yrs ago — the last time that temperatures were above what we are seeing today. We are heading into uncharted territory and wreaking havoc on earth’s life support systems.
The global average temperature from March 2023-February 2024 was 1.56°C above the pre-industrial average. 2023 was the hottest year on record. 2024 may well break that record.
What’s the big deal? The impacts of global warming
The heat and precipitation shifts brought by global warming have wide ranging, interconnected, and compounding impacts

Severe weather and climate events and their impacts on humans
Global warming demonstrably increases the likelihood, severity and/or frequency of climate disasters/severe weather events such as hurricanes, droughts, heatwaves, wildfires, marine heat waves, severe winter storms, torrential rainfalls, typhoons and shifts such as permafrost thawing, loss of arctic sea ice, and the melting of glaciers and ice sheets causing sea level rise, flooding and coastal erosion.

Severe weather and climate events are felt by populations across the globe but greater impacts are experienced by people in developing countries and less advantaged people in developed countries that live in more affected areas and/or may be more vulnerable to climate risks, less able to adapt to climate change and less able to recover from loss and damage.
It is important to note that these populations also have contributed little to the problem of global warming.

Loss of Biodiversity, species shifts, and disruption to ecosystems
Rapid shift in ecosystems that species don’t have time to adapt to.
This leads to adverse impacts for a vast number of plant and animal species as their habitats are lost or become hotter, wetter, drier, more acidic, etc. which can cause changes in population phenology and ranges, including population reductions and local or global extinctions as well as shifts to new areas. These changes impact food webs and ecosystem composition.

Biodiversity loss is tragic in and of itself, but population changes and extinctions also a) bring risks to ecosystems, food systems and water systems that humans depend on (or want), b) reduce ecosystem’s abilities to serve as carbon sinks (removing carbon from the atmosphere) and c) increase risks to human life and health due to disease outbreaks.
Ecosystem loss can also have significant economic impacts on the forestry, fishing, tourism and other ecosystem dependent sectors.

Tipping point changes — irreversible shifts, some of which can cause runaway climate change
“Tipping point” changes in earth’s interconnected life support systems (Cryosphere, biosphere, ocean, and atmosphere) are abrupt and irreversible state shifts in systems that may be self-sustained by feedback loops and may cause runaway climate change and/or destabilizing, catastrophic and/or cascading effects (see examples below.)
Tipping points are triggered once a global warming threshold is passed but given the complexity of earth systems, scientists can only approximate when they may occur.

Often there are early warning signs as the systems weaken but we don’t know exactly when tipping will happen.
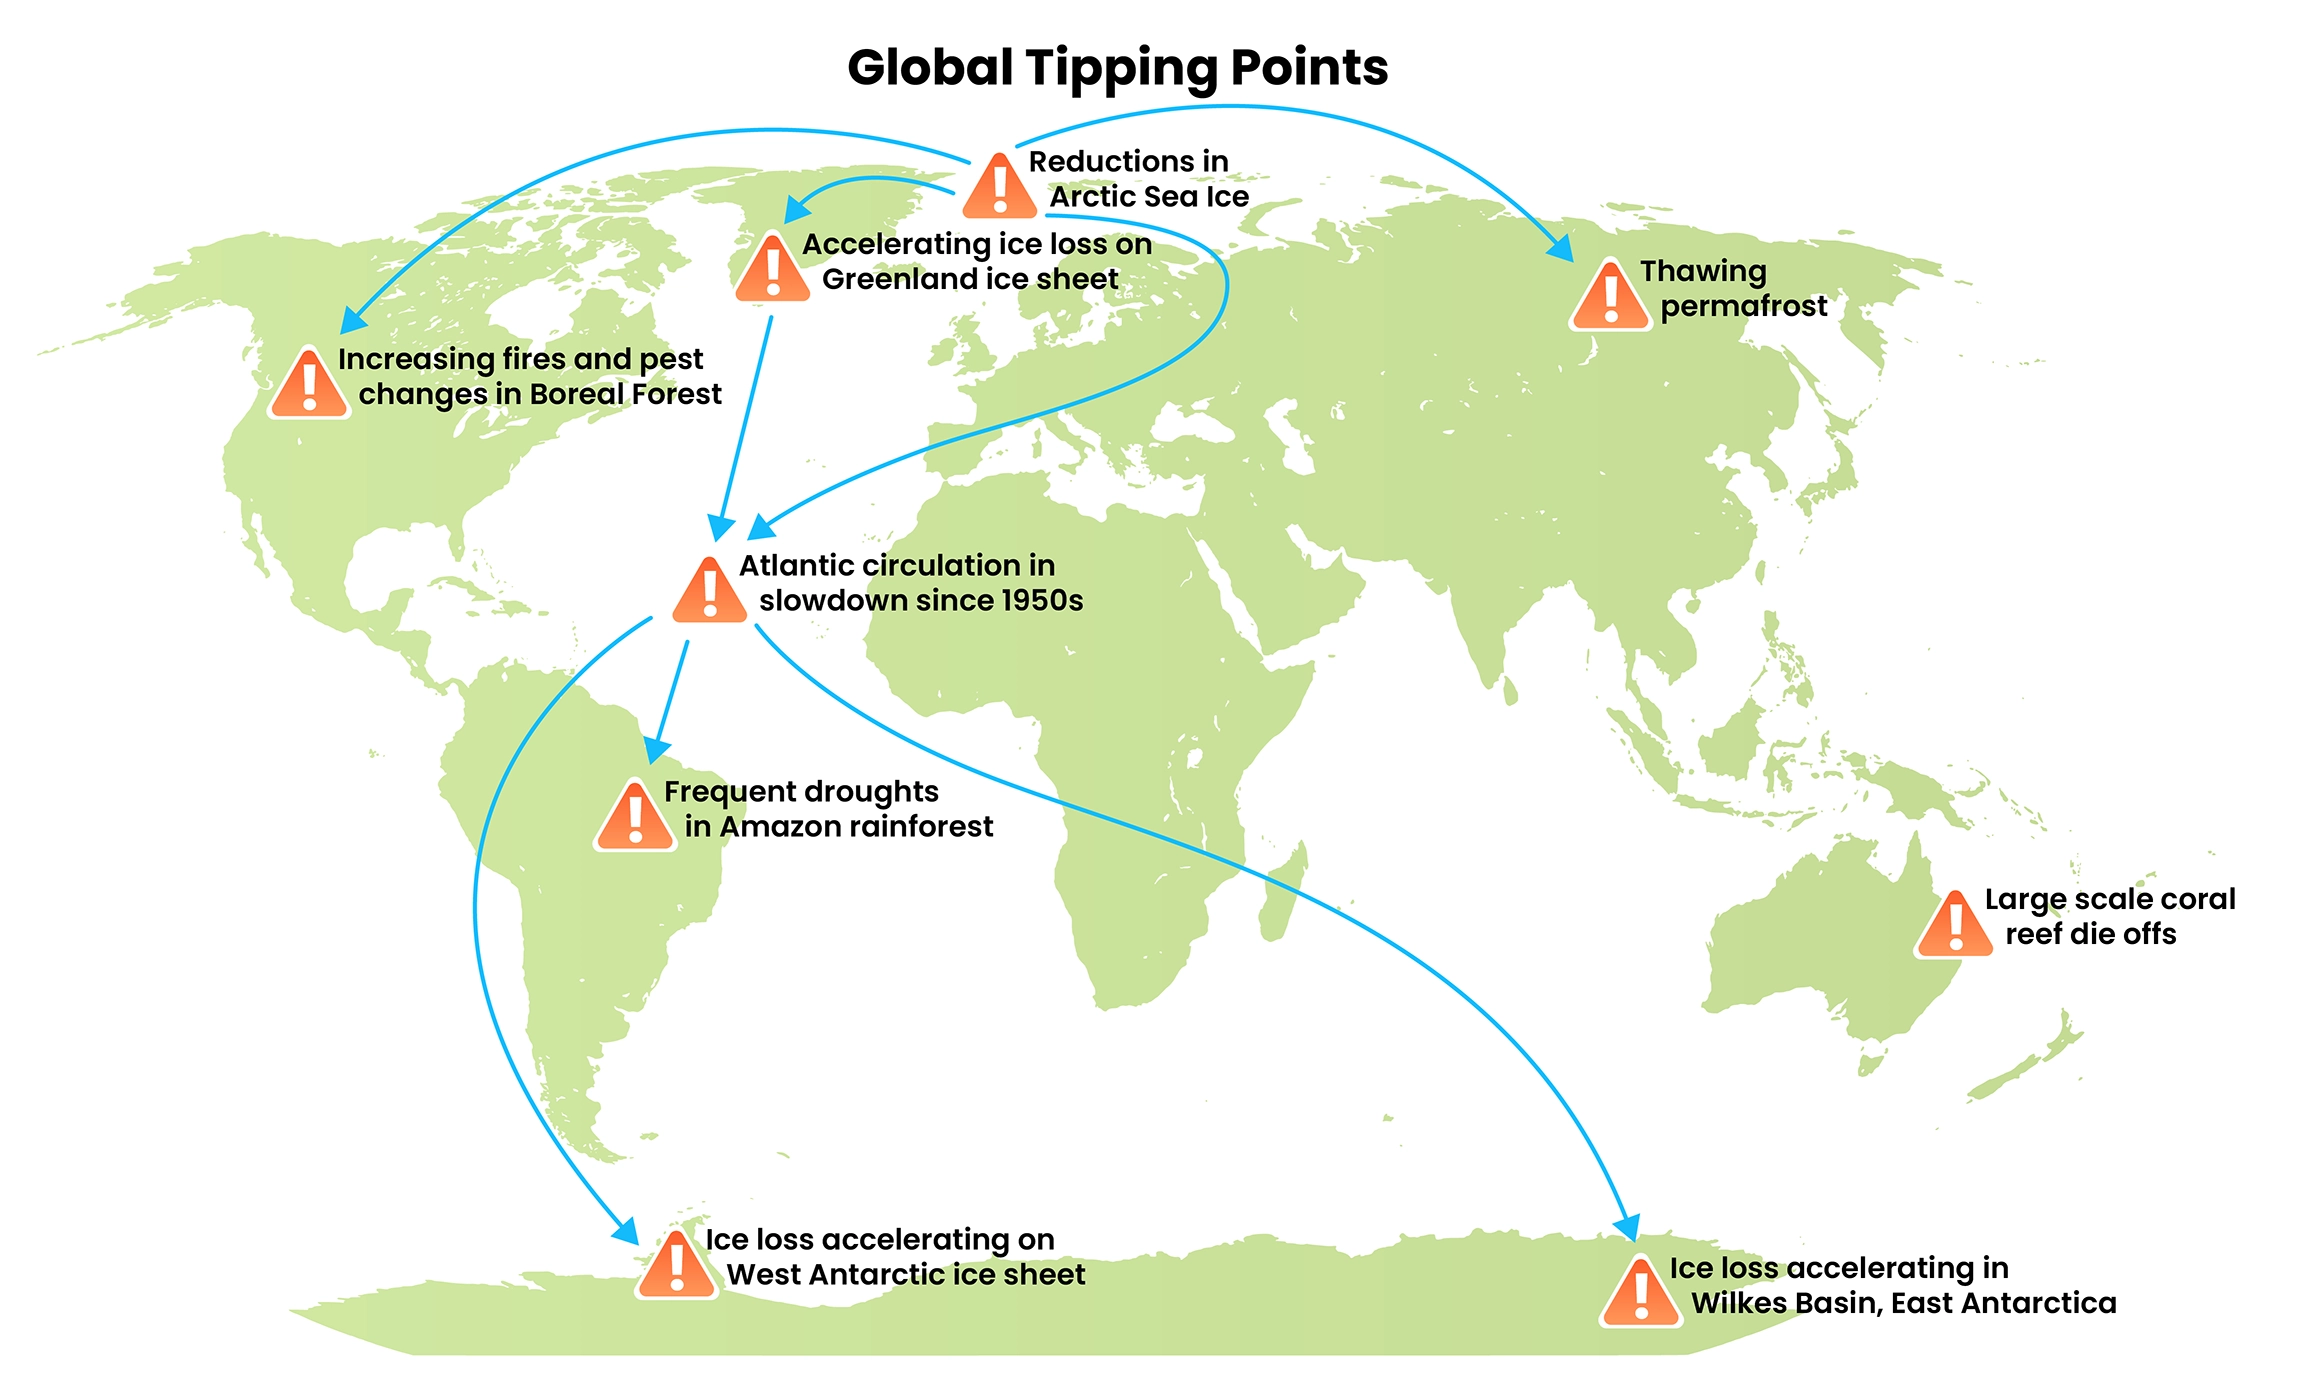
Some tipping points

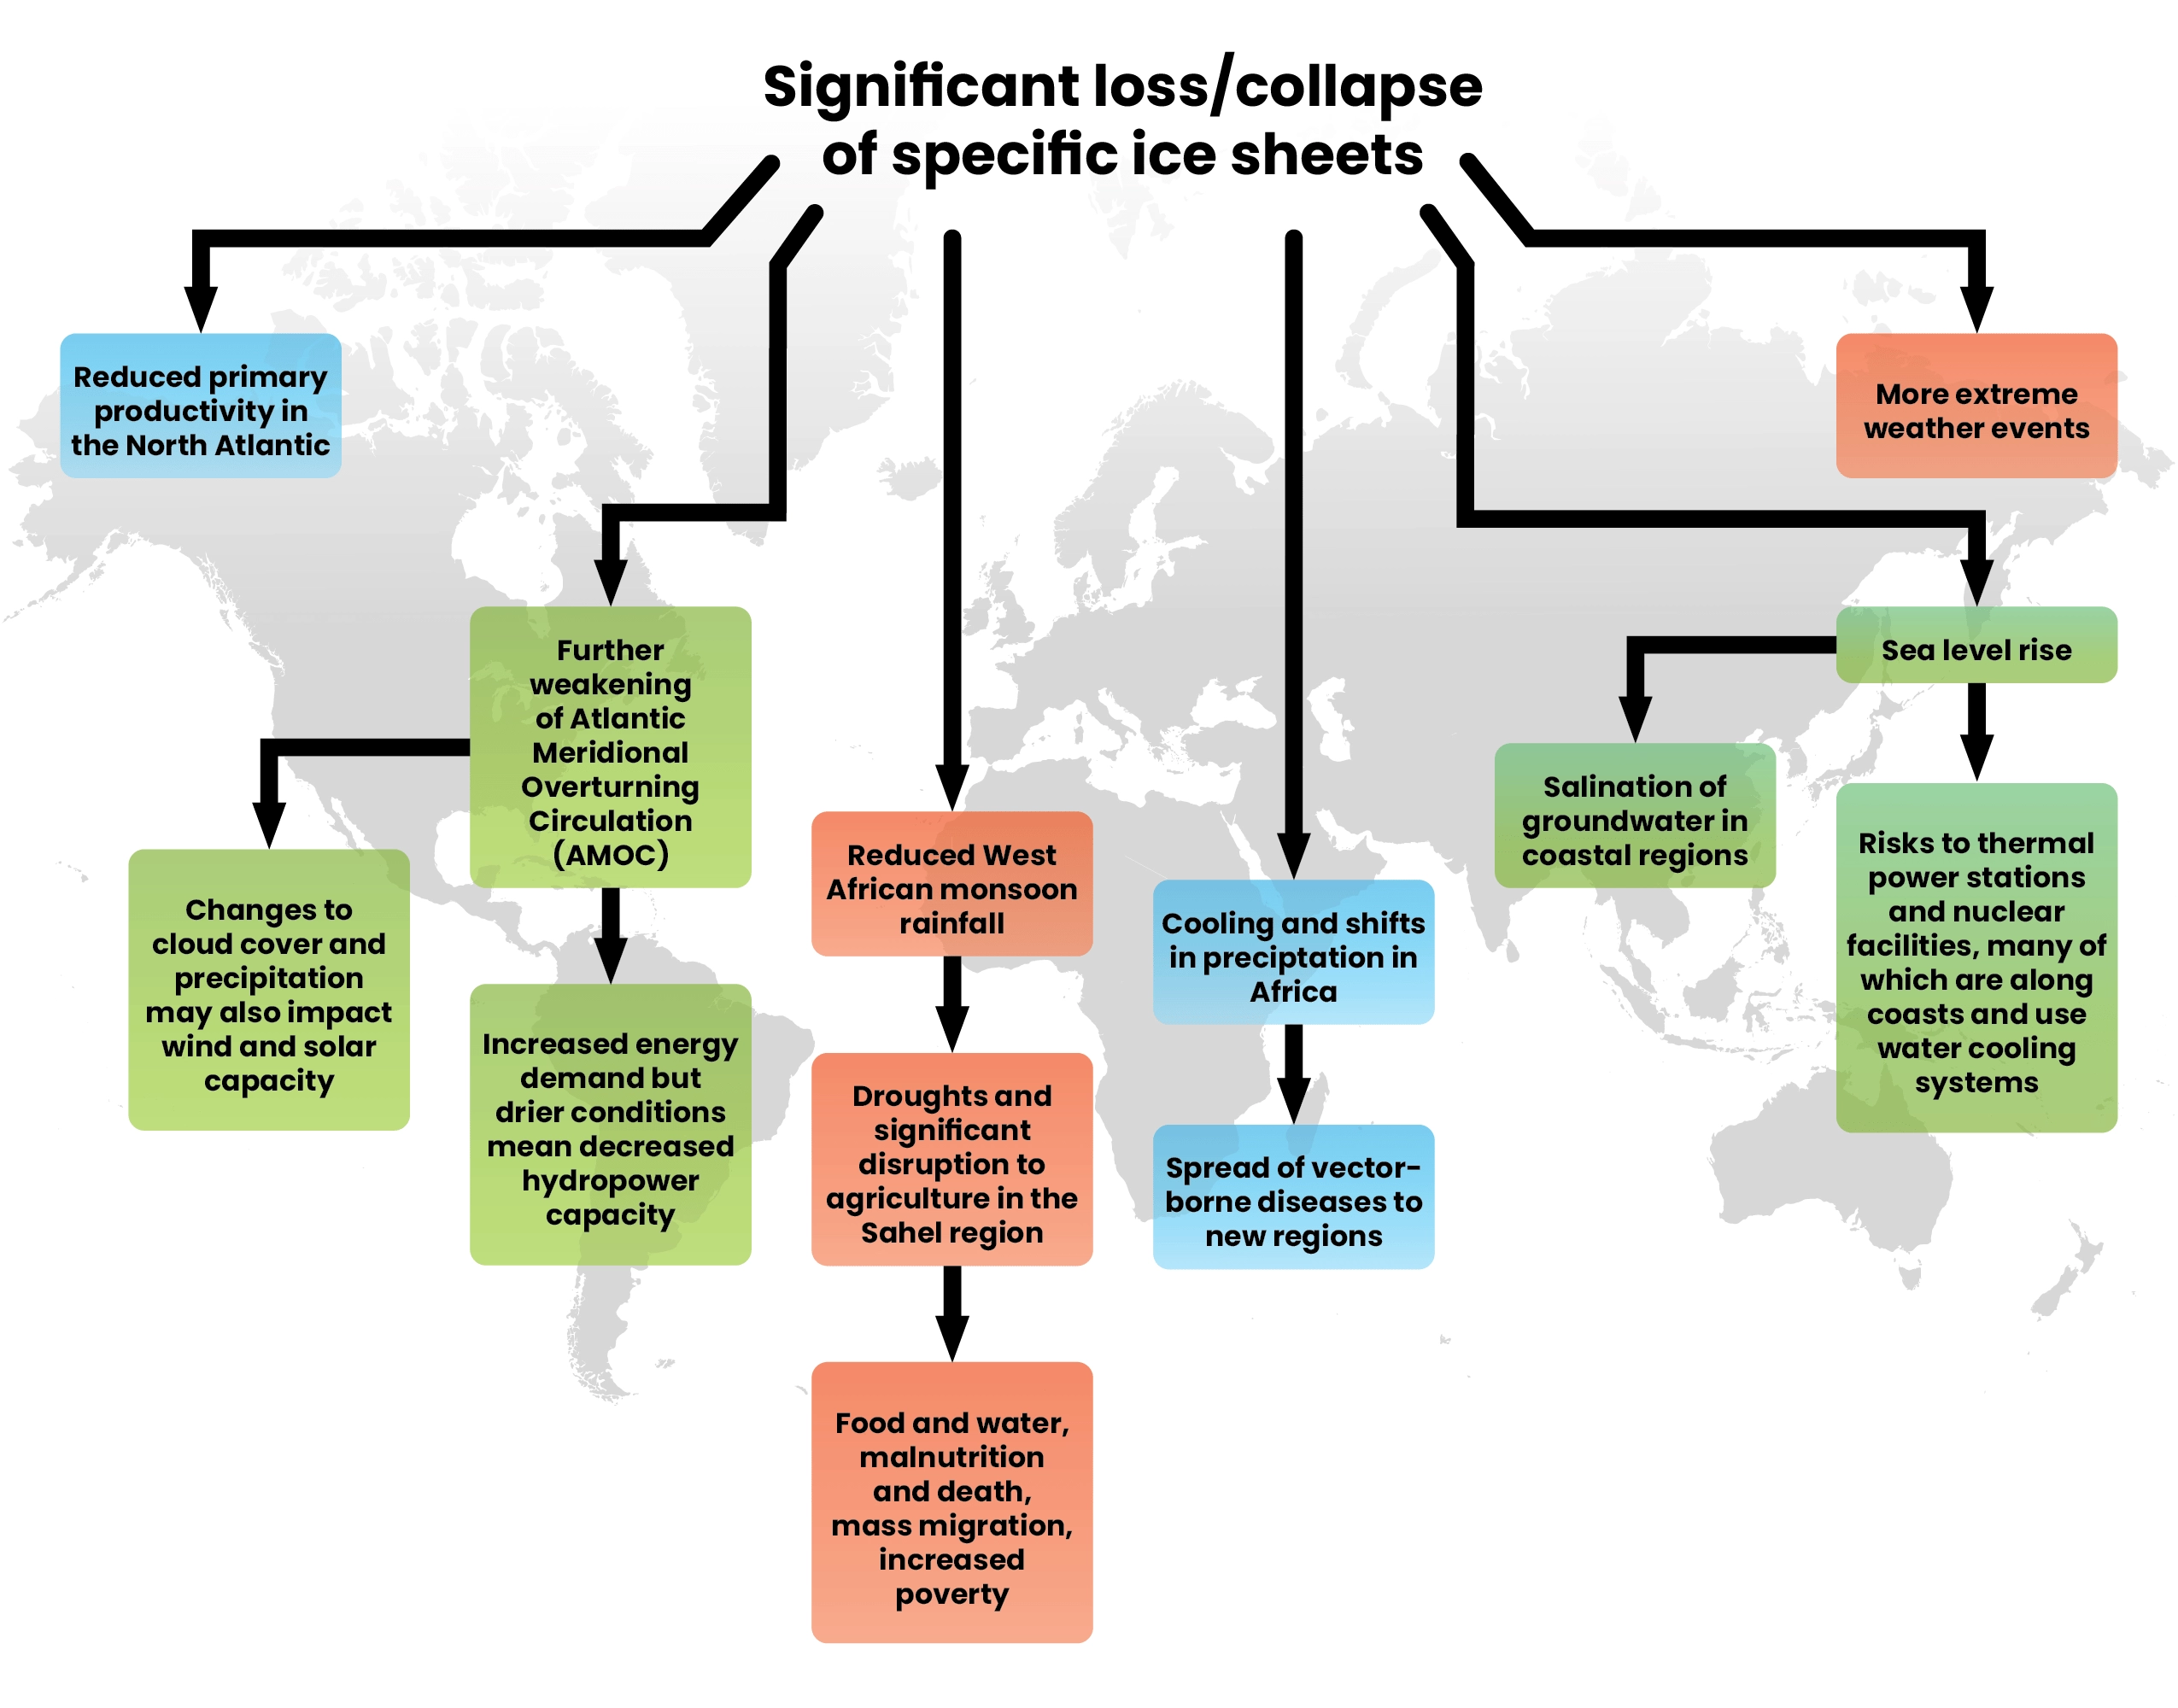
• Ice sheets of Greenland and Antarctica — tipping points could occur when the warming ocean and a critical mass of melting has occurred triggering runaway, irreversible melting over the long term via a feedback loop. It is estimated that runaway melting of ice sheets could, at worst, cumulatively lock in unavoidable long-term global sea level rise of over 20 meters, with unavoidable, devastating effects for future generations.
Even at lower levels of melting, sea level rise has widespread and cascading effects.

• The Amazon and other rainforests — local forest collapse could trigger cascading effects on rainfall cycling, intensifying dry seasons and wildfires, which, in combination with human disturbance and land use changes, can lead to massive forest loss at much larger scales (particularly in the Southwest of the basin.)
Forest dieback can turn the Amazon — a critical carbon sink — into a carbon source, thereby causing more warming, Biodiversity loss and dieback.
The Amazon is estimated to contain between 150 and 200 gigatonnes of carbon in biomass and soil organic matter, equivalent to about 15–20 yrs of current global anthropogenic emissions. Under extreme deforestation conditions, this could add an additional 0.3°C by 2100.
• Boreal forests — significant diebacks in southern boreal forests (carbon sinks) due to increases in wildfires and insect invasions could lead to a transition to prairie land. The burning and loss of forests will release carbon, causing more warming and dieback.
• Marine ecosystems — global warming induced impacts on coastal systems include coral reef ecosystem collapse due to ocean warming and acidification, mangrove and seagrass ecosystems die-off (carbon sink to source) from severe storms and marine heatwaves.
Global warming induced ocean deoxygenation leads to major changes in ocean productivity, Biodiversity, and biogeochemical cycles with possible irreversibility for the deep ocean.

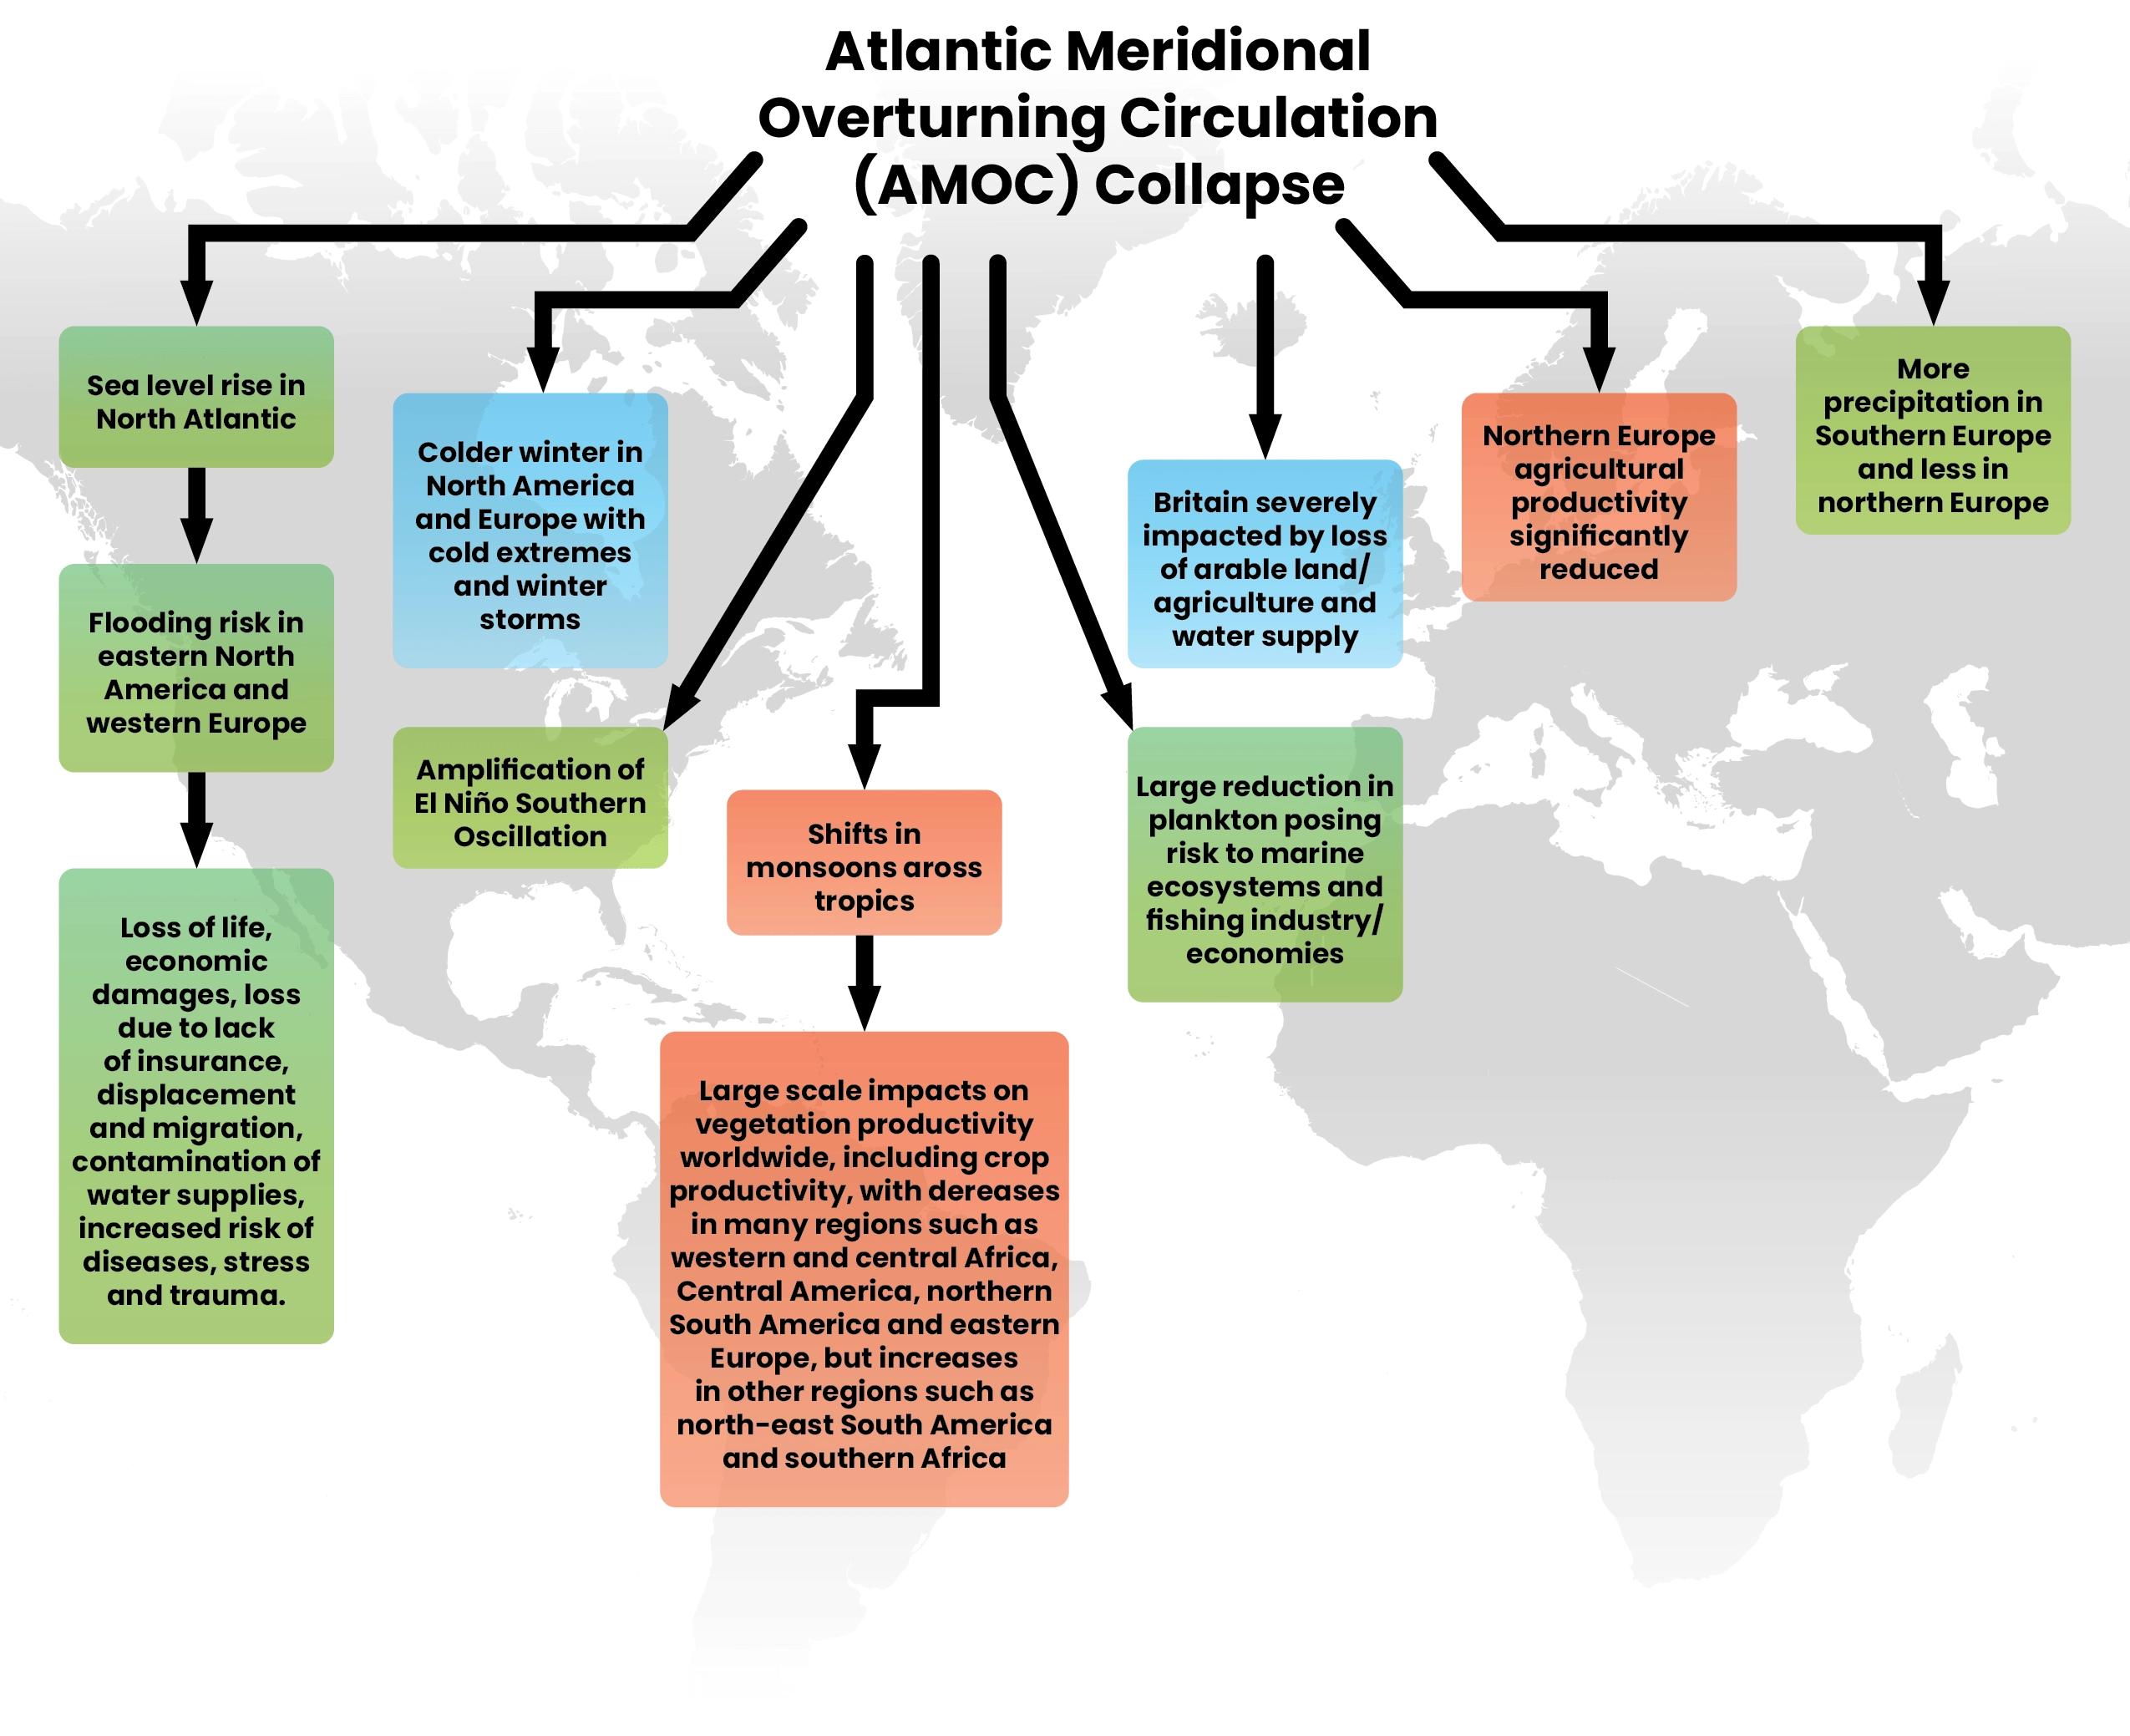
• Atlantic Meridional Overturning Circulation — The AMOC moves heat from the South to the North Atlantic regulating the mild climate of western and northern Europe and helping to maintain the 1–2°C temperature difference between the global Northern and Southern hemispheres. Climate change (e.g. through changes to ocean temperatures) may cause the AMOC to slow or even stop with severe and widespread consequences.
AMOC collapse would lead to dramatic cooling over most of the Northern Hemisphere (e.g. up to 10°C lower than pre-industrial levels in Europe.) It would also trigger dramatic changes to monsoon patterns impacting storms and rainfall events globally, impact sea level rise around the North Atlantic, change sea ice and permafrost distribution, reduce carbon uptake by the ocean and possibly increase ocean deoxygenation, which will further disrupt marine ecosystems.
• North Atlantic Subpolar Gyre (SPG) ocean system could collapse. SPG weakening or collapse would lead to more extreme weather in Europe and colder conditions with major impacts on ecosystems and irreversible impacts on marine and terrestrial Biodiversity even if we eventually reverse global warming.
• Antarctic Ocean Circulation (AOC) could collapse. AOC collapse would lead to a dryer Southern Hemisphere and wetter Northern Hemisphere, a reduction in the efficiency of the global ocean carbon sink and disruption of marine ecosystems and possible amplification of Antarctic ice shelf warming and melting.
Global warming actual and predicted impacts at different temperature levels
The impacts today at ~1.2°C above preindustrial levels

Severe weather and climate events and their impacts on humans
Severe Climate Events in 2023
If you take a few seconds to review the news posted on the floodlist site you will get a sense of the ongoing active impact of the crisis based on floods alone.
Not all severe weather in the world is due to climate change. Scientists use attribution science to determine whether and how much climate change increases the likelihood, frequency, or severity of weather events and even the likelihood and severity of specific events.
71%
of 504
of the extreme weather events and trends that occurred between 2000 and 2022, evaluated by scientists using extreme weather attribution models were made more likely or more severe by human-caused climate change.
Of 152 extreme heat events studied
93%
were more likely or more severe due to human-caused climate change.
The same was true for 68% of droughts and 56% of extreme rainfall events.
It is estimated that at least
12000
people lost their lives in 2023 due to climate related disasters.
— up 30% from 2022.
Almost half (45%) of those killed were from countries responsible for 0.1% of the world’s emissions
Recent research attributes
37%
of heat-related deaths to human-induced climate change.
Heat-related deaths among those over 65 have risen by 70% in two decades.
The 2019-2020 southeastern Australian wildfires resulted in the deaths of
33
people. They also caused a further 429 deaths and 3230 hospitalizations due to cardiovascular or respiratory conditions.
Observed mortality from floods, drought and storms was 15x higher for countries ranked as highly vulnerable compared to less vulnerable countries over the last decade. Between 1970 and 2019, 7% of global disaster events were drought related but they contributed to 34% of disaster related deaths, mostly in Africa.
Droughts, floods, wildfires, and marine heatwaves contribute to decreased food availability and increased food prices which threaten food security, nutrition, and the livelihoods of millions of people. Extreme weather events cause economic losses in forestry, crop production, and livestock farming.
3.6
billion people already live in areas highly susceptible to climate change.
In sub-Saharan Africa, Asia, Central and South America, and other regions, temperatures have crossed heat tolerance thresholds leading to losses in crops, livestock, fisheries, and aquaculture. Work hours lost due to heat have also increased significantly over the last 2 decades and some regions are already experiencing heat stress conditions that have reached the upper limits of labour productivity, particularly in sectors dependent on outdoor manual labour such as construction and farming.
Climate change impacts food productivity, access, nutrition, and risk of illness for hundreds of millions of people and every increment of warming increases the risk that some of our current global crop and livestock areas will become climatically unsuitable.
The frequency of sudden food production losses has increased since the mid-1900s, with the impacts of climate events on food security felt most acutely in sub-Saharan Africa, Asia, small islands, Central and South America, and the Arctic.
Although some have argued that elevated carbon is good for plant growth (called the carbon dioxide fertilization effect) the reality is that productivity has been negatively impacted by climate change.
For example, there is evidence that total productivity has declined 21% since 1961 due to anthropogenic climate change, with greater impacts (26-34%) in Africa, Latin America, and the Caribbean52.
The carbon dioxide fertilization effect is more than compensated for by droughts, heat stress, crop damage from extreme weather events, increased surface level ozone, decreases in air, soil and water quality, human activities such as deforestation, draining of peatlands and tropical forests (which turns carbon sinks into carbon sources), and the expansion of woody plants in grasslands and savannahs as a result of increased carbon dioxide levels which reduces grazing land and increases the risk of fire.
Crop and livestock losses also contribute to lost livelihoods and increased food prices, with vulnerable populations most at risk of food insecurity and malnutrition.
In coastal communities, climate change also increases the presence of harmful algal blooms and water-borne diseases that threaten food security and livelihoods of fishing communities.
Food safety risk has also increased because high temperatures and humidity caused by climate change increases the presence of toxigenic fungi on many food crops (mycotoxins are associated with cancer and stunting in children), and ocean warming and acidification enhance the movement and bioaccumulation of toxins and contaminants such as methyl mercury in marine food webs, impacting fisheries.
Severe water scarcity is currently experienced by about half of the world’s population for at least 1 month/year in part due to climate change, with the impacts being felt most severely in low-income economies. The impacts are exacerbated by poor water governance and competition for water resources by the energy industry, agriculture, and other industries. Water insecurity can also lead to social unrest, displacement, and other vulnerabilities.
Every year, over 20 million people have been displaced within their own countries by extreme weather-related events since 2008 (most commonly because of storms and floods.)
Extreme climate events directly (e.g. through destruction of homes) and indirectly (e.g. drought related loss of livelihood) cause involuntary migration and displacement. The largest amount of displacement occurs in Asia, followed by sub-Saharan Africa and small islands in the Caribbean and South Pacific.
Involuntary migration can lead to poor socioeconomic and health outcomes. Forced displacement by governments can also lead to significant financial and emotional distress particularly where there is cultural or spiritual significance to the land being lost. Displacement impacts mental health, well-being, livelihoods and opportunities (including education.)
In cities and settlements, sea level rise, heatwaves, droughts, floods, wildfires, and permafrost thaw cause disruptions of key infrastructure and services including energy supply and transmission, communications, food and water supply, and transport systems in and between urban and surrounding areas.
In many cities, the presence of informal settlements, made worse by displacement from rural and coastal areas, increases a population’s vulnerability to extreme weather and climate events and limits the capacity for adaptation.
In sub-Saharan Africa, about 60% of the urban population lives in informal settlements and in Asia, about 529 million people live in informal settlements. Exposure to climate-driven impacts such as heat waves, extreme precipitation and storms alongside rapid urbanization and lack of climate adaptation in urban planning increase the vulnerability of urban populations.
Coastal cities and communities are more vulnerable to the compounding impacts of climate variability and sea level rise. About 10% of the world’s population and physical assets (including many mega cities and 14% of the world’s GDP) are within less than 10m above sea level.
Between 2006 and 2016, the rate of global sea level rise was 2.5x faster than it was for almost all of the 20th century.
Early impacts of accelerating sea level rise have been detected along some coasts already, including periodic or chronic flooding at high tides, water-table salinization, agricultural, fishery and ecosystem degradation, increased erosion, and coastal flood damage.
Water contamination also increases the risk of water-borne diseases and compromises sanitation and access to fresh water. Areas highly vulnerable to flooding impacts include informal settlements within cities, areas with land subsidence (e.g. Bangkok, Jakarta, Lagos, New Orleans, Mississippi, Nile, Ganges-Brahmaputra deltas) and small island states.
Current protections are anticipated to become more costly or inadequate in future. Relocation of millions of people may be needed in some cases (for example, Jakarta will be moved inland, partly as a result of climate change.)
By 2050, it is projected that more than a billion people located in low-lying cities and settlements will be at risk from coast-specific climate hazards.
Under all warming scenarios, low lying cities and settlements, small islands, Arctic communities, remote indigenous communities, and communities living in river deltas will face severe disruption by 2100 and as early as 2050.
Risks to water security will occur as early as 2030 or earlier for the small island states and Torres Strait Islands in Australia and remote Maori communities in New Zealand.
By 2100, compound and cascading risks will result in the submergence of some low-lying island states and damage to coastal heritage, livelihoods, and infrastructure along many other coasts. Sea level rise, combined with altered precipitation patterns will increase coastal inundation and water-use allocation issues between water-dependent sectors such as agriculture, direct human consumption, sanitation, and hydropower.
In Europe, coastal flooding damage is projected to increase 10-fold by 2100. Projected impacts will reach beyond coastal cities and settlements with damage to ports that may severely impact global supply chains and maritime trade.
Vulnerable coastal communities may face adaptation limits well before the end of this century even at low warming levels and current solutions may be less viable in a warmer world.
For example, droughts have reduced thermoelectric and hydropower production by around 4–5% compared to the 1980s, reducing economic growth in Africa and putting at risk billions of dollars of existing and planned hydropower infrastructure assets in Africa and mountain regions worldwide.
Drought-related reductions in hydropower have also resulted in increased fossil fuel use in China.
Changes in temperature, precipitation, and water-related disasters are linked to increased incidences of waterborne diseases such as cholera, especially in regions with higher vulnerability — e.g. where there is limited access to safe water, sanitation, and hygiene infrastructure.
More extreme events and shifts in precipitation have contributed to vector-borne disease outbreaks. Climate change is contributing to the spread of chikungunya virus in North, Central and South America, Europe and Asia; tick-borne encephalitis in Europe; Rift Valley fever in Africa; West Nile fever in multiple regions; Lyme disease vectors in North America and Europe, malaria in Africa and dengue globally.
For example, compared to the 1950s, the reproduction potential for dengue in Central and South America has increased between 17% and 80% (depending on the region), because of temperature and precipitation changes.
Zoonoses that have historically been rare or never documented in the Arctic and sub-Arctic regions of Europe, Asia, and North America are emerging as a result of climate-induced environmental change, spreading northwards and increasing in incidence (e.g. anthrax, tularaemia.)
Spring pollen season start dates in northern mid-latitudes are occurring earlier due to climate change, increasing the risks of allergic respiratory diseases.
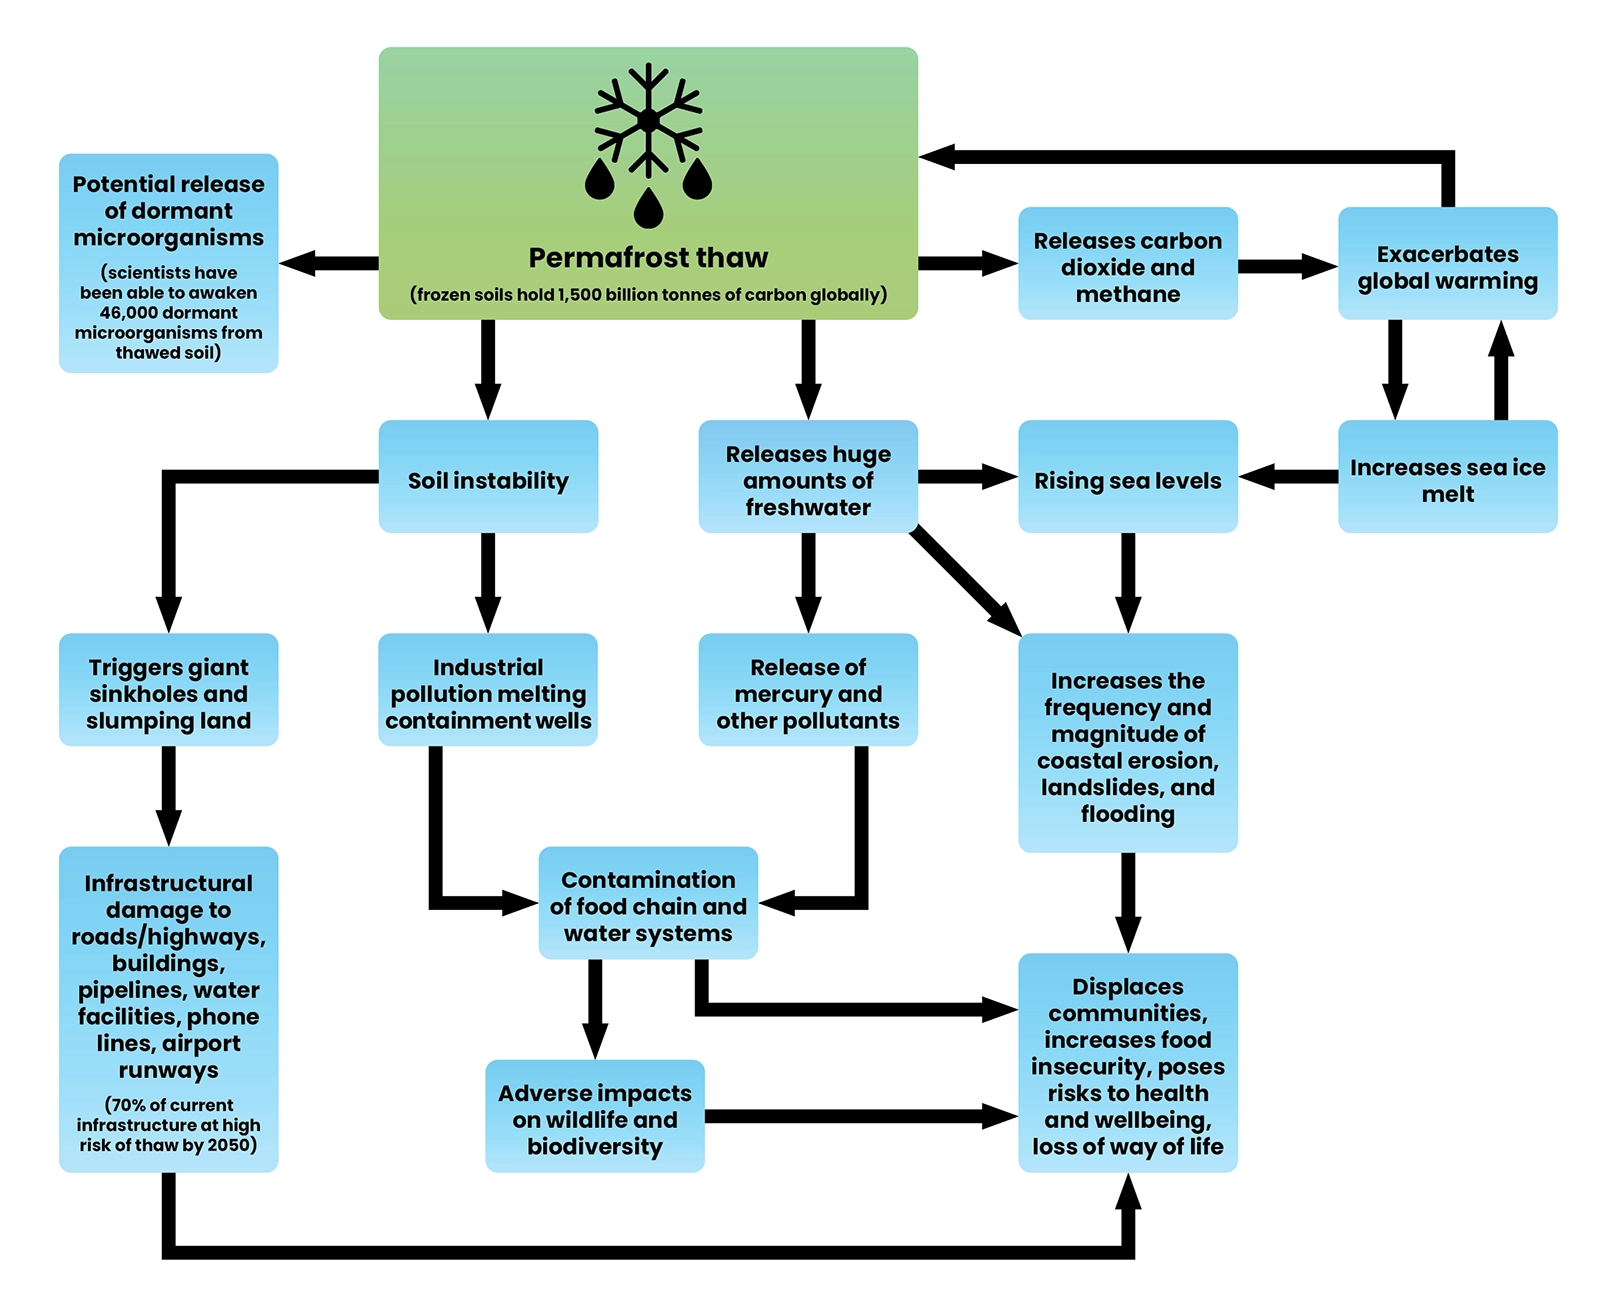
The shifts in earth’s systems are wreaking havoc even before they reach or cause irreversible tipping point changes. Just as the melting of ice sheets is driving sea level rise with wide-ranging impacts even at low levels of warming, the shifts in other systems are also impacting communities and ecosystems today. The depiction below is a simplified view of the impacts of permafrost thaw.
Importantly, Indigenous Peoples in the Arctic that are more directly dependent on the environment for subsistence are disproportionately negatively impacted already by climate change.
Here are a few videos that remind us about the people and animals behind the numbers.
The impacts today at ~1.2°C above preindustrial levels

Loss of Biodiversity, species shifts, and disruption to ecosystems
Human-caused climate change has created conditions not seen in millennia that have altered marine, terrestrial, and freshwater ecosystems all around the world at a rate too fast for species to adapt to.
Half to two-thirds of species have shifted their ranges to higher latitudes, and about two thirds have shifted to earlier spring events in response to warming which has led to emerging hybridization, competition, and mismatches in space and time for predator-prey, insect-plant (including pollinators) and host-parasite relationships. Disease vectors and invasive species are also moving north.
Range shifts reduce Biodiversity in the warmest regions and locations where adaptation limits are exceeded. These shifts also homogenize Biodiversity in regions receiving climate-migrant species and alter food webs.
Climate change has caused local species extinctions, mass mortality events and loss of resilience in ecosystems.
Local population loss, often as a result of extreme weather events, has been observed in 50% of 1000s of species studied.
Mass mortality has been observed in many species including, for example, corals, mangroves, fruit bats, and some freshwater fish.
Populations are declining in about
50%
of vertebrate species.
70%
of the world’s most biodiverse regions are now under threat due to rising ocean temperatures.
Global decline in amphibians (esp. salamanders and frogs) continues with climate change being a primary driver.
Between 2004 and 2022 there was a
39%
increase in amphibian species on the Red List Index of threatened species.
41%
are now globally threatened.

Coral reefs — thermal bleaching tipping points are already being passed in the majority of coral reef regions and ecosystem collapse is anticipated for all regions by 2040–2050.
We are seeing loss of resilience and regional dieback of mangrove and seagrass ecosystems, for example, in Australia, Panama, and the Maldives. These are important carbon sinks as well.
Extinct — Bramble Cay melomys — endemic to Bramble Cay, in the Great Barrier Reef, Australia — went extinct because of climate change driven rise in sea levels that destroyed its habitat.
Extinct — Golden toad — endemic to Costa Rica — went extinct due to climate change driven changes in rainfall patterns.
Critically Endangered — Corals — many locations — mass bleaching and die-off primarily due to climate change driven ocean warming and acidification.
Endangered — Chinook salmon — multiple threats including several related to climate change; migration is impacted by reduced water levels in freshwater streams due to loss of snow and glaciers, warmer ocean temperatures make salmon more susceptible to diseases, parasites and predation and rising sea levels make water composition of estuaries that these salmon rely on unsuitable.
Endangered — Green sea turtle — warming temperatures alter their sex ratios to the point that some nesting beaches produce 99% females.
Threatened/Vulnerable — Polar bear — climate change is threatening their habitat due to reductions in Arctic sea ice.
Vulnerable — Adelie penguin — climate change driven Antarctic sea ice melt is destroying the ice habitat of their primary food source (krill.)
Vulnerable — Bumblebees — multiple threats including some related to climate change; bumblebees are being driven northward but with changing phenology of flowering plants as well (due to climate change) they have a shorter foraging period. They are also at risk from changing precipitation patterns (extreme rainfall and droughts), floods and wildfires that can destroy their habitats. (note the same applies to many insect species.)
Critically Endangered — North Atlantic right whales — climate change driven ocean warming and changing ocean currents are impacting their food sources, resulting in a drop in their birth rates as females travel further for food and are exposed to other threats. (note that other whales and many ocean species are also currently adversely impacted by climate change driven changes to the ocean.)
Endangered — Asian elephant — climate change driven increased warming and changes in rainfall patterns (both floods and droughts) are impacting their reproductive capacity.
The impacts today at ~1.2°C above preindustrial levels

Tipping point changes—irreversible shifts, some with risk of causing runaway climate change

Amazon Rainforest
75% of the Amazon has experienced loss of resilience since the early 2000s. Localized dieback is occurring.

Boreal Forests
Canadian Boreal forest — evidence of localized dieback with recent failure to regenerate. Warning signs in 2023 of substantial change in forest dynamics and loss of resilience.
Siberian Boreal forest — may have approached a tipping point with widespread regeneration failure following intensification of fires.

Ice Sheets and Glaciers
Ice sheets of Greenland and West Antarctica — 1–3 metres of sea level rise is likely locked in over 1000-2000 years. This means that even if we stop adding greenhouse gas emissions to the air tomorrow, the heat we have already trapped will continue to melt the Cryosphere for sometime, causing unavoidable sea level rise over the next 100s to 1000s of years. In addition to coastal erosion, annual flooding and other impacts, melting would alter monsoon rainfall in West Africa, impacting agricultural production and increasing the risk of displacement for millions of people there.
Mountain glaciers — possible tipping points reached for glacial melting.

Coastal Systems
Coral reefs — thermal bleaching tipping points are already being passed in the majority of coral reef regions and ecosystem collapse is anticipated for all regions by 2040–2050.
Mangrove and Seagrass ecosystems — loss of resilience and regional dieback is occurring in Australia, Panama and the Maldives.

Atmosphere / Ocean Systems
Atlantic Meridional Overturning Circulation (AMOC) — showing early warning signals and some evidence of weakening.
North Atlantic Subpolar Gyre (SPG) — have reached temperature range (1.1 to 3.8°C) where models suggest collapse is possible.
Antarctic Ocean Circulation (AOC) — weakening and contributing to ice sheet loss and therefore sea level rise.

Permafrost Thaw
Localized tipping is already occurring for permafrost. Even with global reduction in greenhouse gases, permafrost will shrink by 45% by 2100.

Although the global south is most impacted by climate change (though they have contributed little to the problem), the impacts of global warming are felt all across the globe including in Canada.
• The June 2021 heatwave in B.C., which was the most deadly weather event in Canadian history killing 570 people, was made 150 times more likely because of climate change and would have been “virtually impossible” without human-caused warming.
• A new study found the 2018 northern hemisphere heatwave, which killed 74 people in Quebec, would have been “impossible” without climate change.
• One-in-100-year flood events in Toronto and Montreal are expected to become 1-in-15 year events by the end of the century as a consequence of climate change.
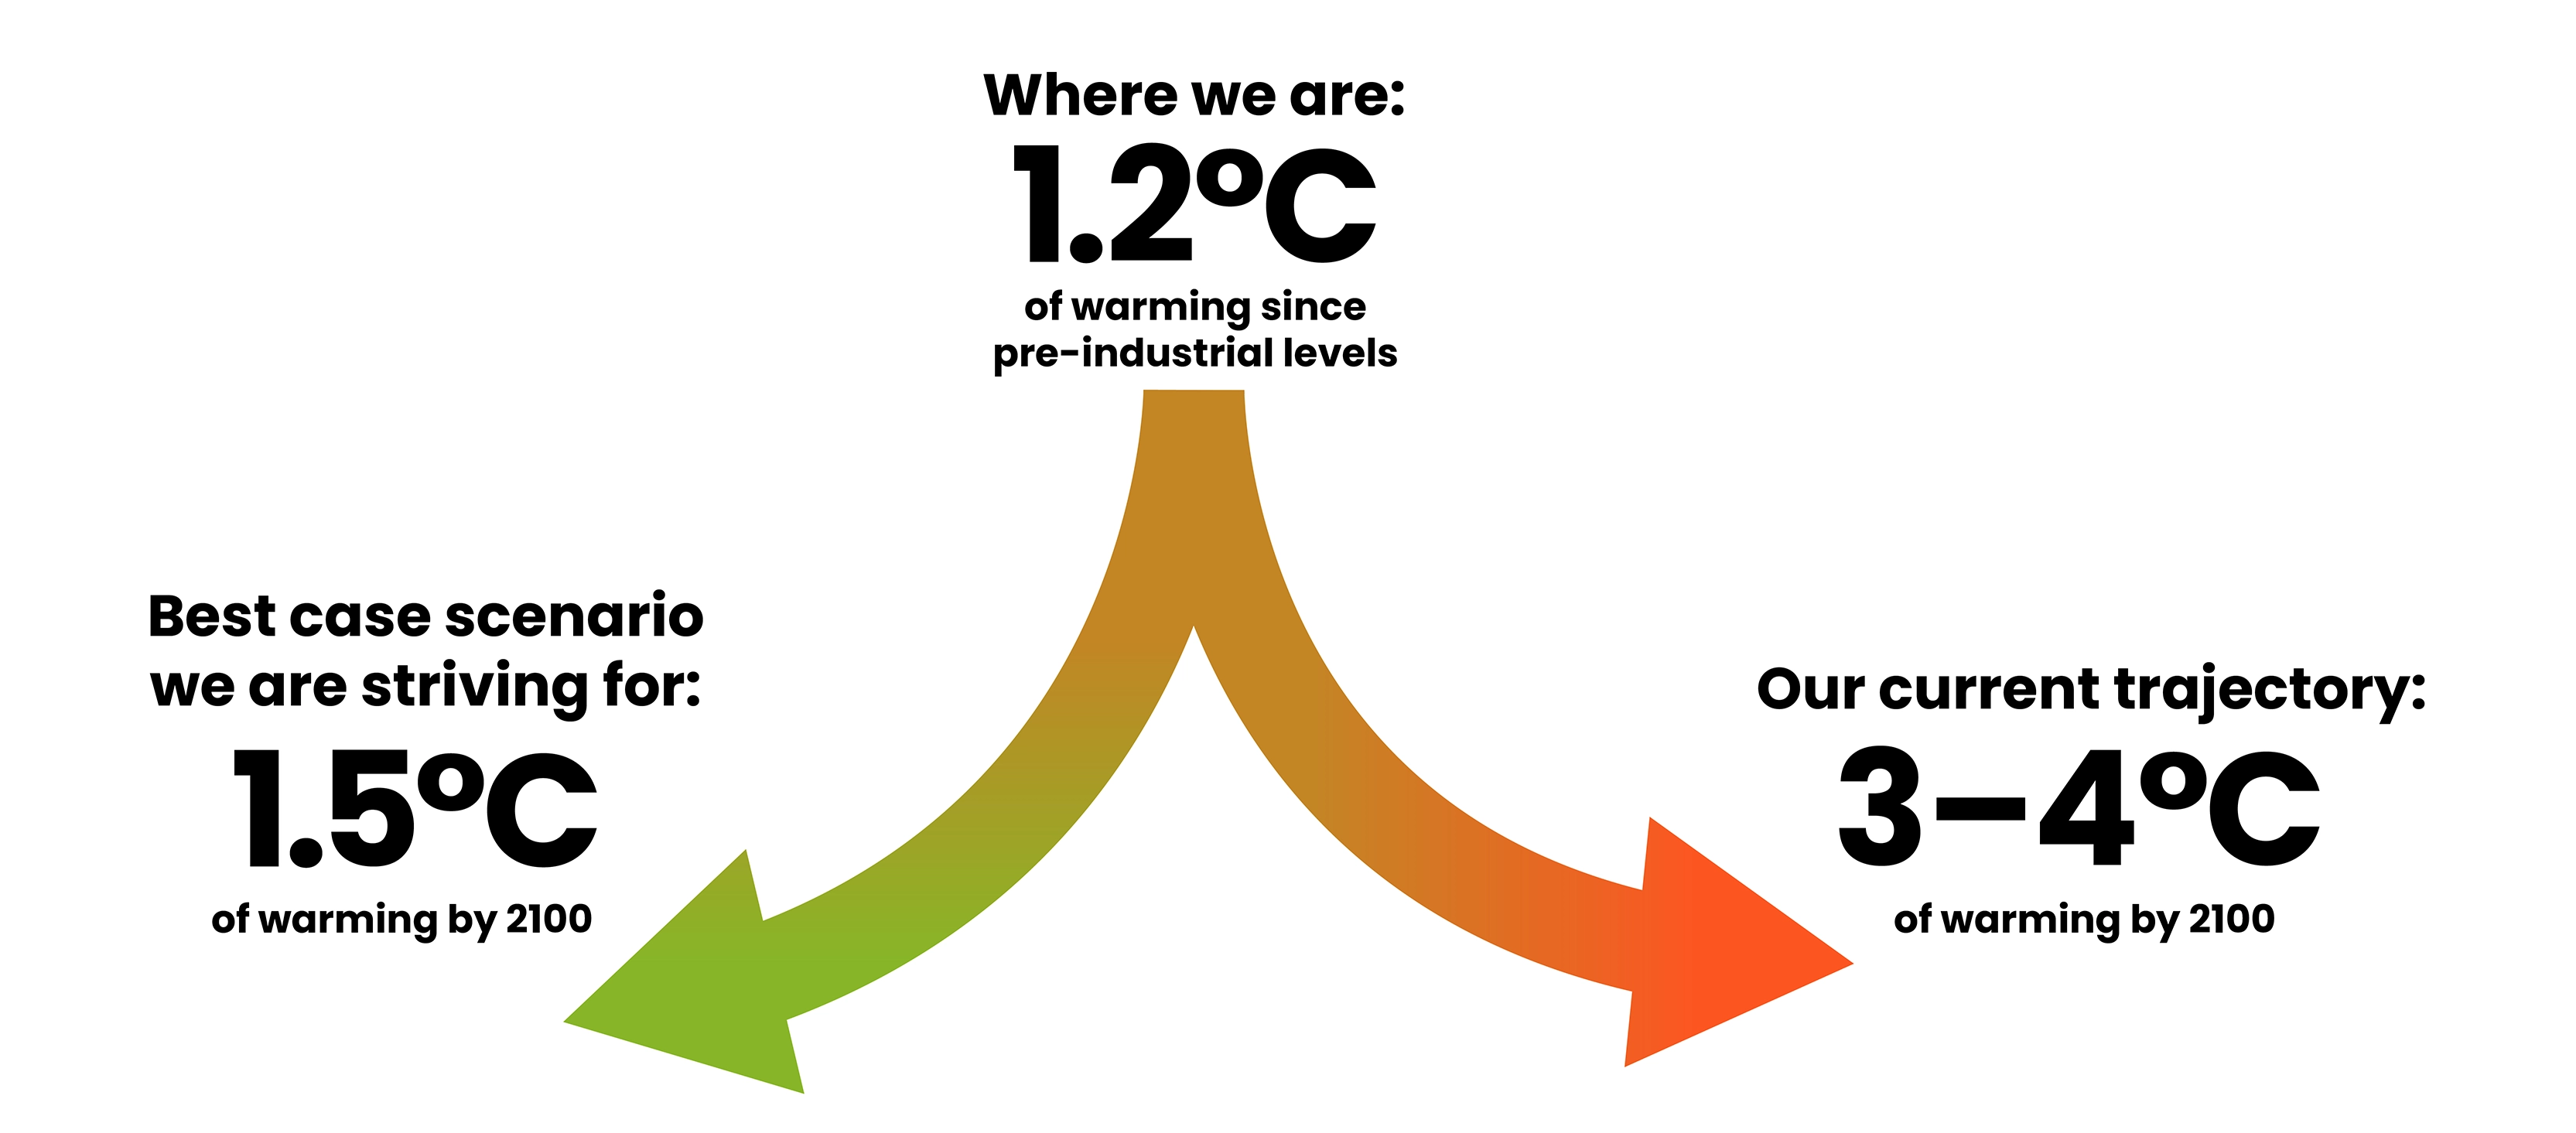
Every degree matters
Every 0.5°C of global temperature rise will cause clearly discernible increases in the frequency and severity of heat extremes, heavy rainfall events, and regional droughts with associated societal impacts.
In addition to direct negative impacts on death rates, health, livelihoods, displacement, quality of life, and direct damages from disasters, climate change will increase water scarcity, reduce crop yields, reduce fish catch, decrease food safety and nutritional quality and increase the prevalence of human diseases and crop pests.
Risks of extinction of other species increase with each degree of warming as does the risk of hitting one or multiple earth systems tipping points.
The global warming changes at the temperature we land at will persist for centuries, with some trends (e.g. ice sheet melting) persisting long after we hit Net Zero. The extent of damage will depend in part on how well we adapt, at least at lower temperatures where adaptation is still possible.
However, even at lower temperatures, millions of people and other species are adversely impacted.
Remember, climate change is primarily caused by greenhouse gas emissions from the burning of fossil fuels. The longer we burn them the worse things will be. The more quickly we switch to clean energy, the better our outcomes.
Predicted impacts by 2100 for different temperature increases above preindustrial levels
Overall, the world has put legislation and policies in place to limit the temperature increase ~3°C so far, but not all said policies have been implemented yet. We need to implement them quickly and we need new, additional policies and action to reduce the temperature increase even further. Ideally we can bring the increase to less than 2°C of warming – which will mean more disasters and risk than what we are seeing today, but an increased likelihood that we will avoid the worst impacts of climate change including many tipping points.
Predicted impacts of 1.5°C of warming by 2100
Our Net Zero 2050 goal.

Severe weather and climate events and their impacts on humans
100–400%
in population impacted by floods in Central and South America and Africa (depending on the country.)
4.1x and 1.9°C
in frequency and intensity (resp.) of heat waves globally. (19 more days of extreme heat > today.)
16x
in frequency of marine heat waves.
950
million
people across the world’s drylands that will experience water stress, heat stress, and desertification.

Biodiversity loss
The number of species that will lose most of their ranges is estimated to be
4%
(~2500–2800 species)
for vertebrates which includes mammals.
4%
(~15,000–17,000 species)
for plants.
6%
(60,000+ species*)
for insects.
*based on the number of known species. The actual number may be up to 10X higher given the estimated number of species.
Temporary overshoots above 1.5°C (anticipated if average temperature increase is 1.5°C), will cause additional mass mortality events, particularly in sensitive ecosystems and increase risks to ecosystem integrity, functioning and resilience.

Tipping points

Amazon Rainforest
Continued loss of resilience, drying, and small-scale diebacks will occur in the Amazon rainforest, but collapse most likely avoided.

Boreal Forests
Likely tipping point for Siberian Boreal forest will be reached with forest dieback.
Possible regeneration failure of Boreal forests particularly if the increase in temperature is combined with reduced precipitation.

Ice Sheets and Glaciers
Ice Sheet Melting would lead to approximately 0.2m of sea level rise by 2100 (and 3m likely locked in over 1000-2000 years.) In addition to coastal erosion, annual flooding and other impacts, melting would also alter monsoon rainfall in West Africa, impacting agriculture and posing a displacement risk for millions of people there.
Greenland Ice Sheet — significant loss likely.
West Antarctic Ice Sheet — collapse tipping point possible (causing irreversible runaway melting over 100s of years.)
Mountain glaciers — significant loss of mountain glaciers (causing flooding, landslides, water scarcity.)

Coastal Systems
Coral reefs — largely lost.
Seagrass ecosystems — mass mortality.

Atmosphere / Ocean Systems
AMOC — Further AMOC weakening is predicted but collapse, though possible, is likely avoided.
El Niño Southern Oscillation — amplification possible (predicted to occur in the 1.5°C–4°C range.)

Permafrost Thaw
Increased permafrost thaw adversely impacting Indigenous communities and Arctic ecosystems.
Predicted impacts of 2°C of warming by 2100
If we implement all current policies successfully and on time and up our game a little more.

Severe weather and climate events and their impacts on humans
8–80
million
predicted malnourished people by 2050, primarily in sub Saharan Africa, South Asia, and Central America because of climate-related decreases in food availability and quality.
The number within that largely depends on how much global support vulnerable populations receive.
800
million
to
3
billion
people that are projected to experience some level of water scarcity (including ~30% of those living in southern Europe.)
150–200%
projected increase in frequency of extreme agricultural drought in South America, the Mediterranean, western China, and northern latitudes of North America and Eurasia.
10%
reduction in hydropower potential projected for the Mediterranean.
17–18%
climate-related wheat yield projected losses through herbivores alone in East Asia and Europe/North America resp.
32–59%
climate-related rice yield projected losses from herbivores alone in East Asia and South/Southeast Asia resp.
1.9x and 2.6°C
in frequency and intensity (resp.) of heat waves globally.
23x
in frequency of marine heat waves.
950
million
people across the world’s drylands will experience water stress, heat stress, and desertification.
1000s to 10,000s
additional cases of diarrheal diseases from climate-related events mainly in central and east Africa.
50%
percent increase in climate-related cardiovascular disease mortality by the 2050s compared to the 1980s (at a 2–3°C increase.)
69%
percent of infrastructure that permafrost thaw in the pan-Arctic is expected to damage (at a 2–3°C increase.)
almost
400
million
additional people in urban areas that will be exposed to water scarcity from extreme droughts (at a 2–3°C increase.)
55–68%
percent of commercially harvested inland fish species in Africa vulnerable to extinction by 2070-2100 (at 2.5°C.)
600%
increase in population at risk of displacement from floods following heavy rainfall in Africa (at 2.6°C.)
35%
percent global land area burned by wildfires.
almost
33%
of the population in southern Europe projected to be exposed to water scarcity.

Biodiversity loss
A significant increase in Biodiversity loss is anticipated including almost
1 in 5
insect species
(which impacts many other ecosystems.)
At 2°C the percent of species at risk of local extinction by the 2080s is predicted for
35–47%
of species in the Amazon
29–49%
of species in coastal East Africa
25–30%
of species in Madagascar
16–36%
of species in the Mediterranean
45–50%
of species in central and southern Africa
29-58%
and of species in south-western Australia
10%
of species will be at high risk of extinction, with rates of ecosystem extinction on some mountains and islands — including some Biodiversity hotspots — projected to be 80–100%.
Corals and amphibians are particularly vulnerable but also many plants, insects, mammals, birds, and reptiles.

Tipping points

Amazon Rainforest
The tipping point for transition from rainforest to savannah is possible at 2.5°C.
Even If the Amazon remains largely forested with small scale dieback, climate changes will result in annual widespread high heat stress.
Reaching the tipping point would lead to extreme heat stress across Amazonia, affecting more than 6 million people, leading to mass migration to cities and, with lower river water levels, decreased hydrological power generation (e.g. 40% loss of forest cover by 2050 would lead to a projected 6–36% decrease in river discharge in Xingsu basin, leading to potential 75% reduction in hydropower production.)
Amazon die-back is estimated to lead to economic damages of $600–3500 billion USD over 30 years. As a point of comparison, the Gross Brazilian Amazon Product is approximately $150 billion USD per year.
Both small and large scale die-back can shift the Amazon from a carbon sink to a carbon source, further exacerbating climate change.

Boreal Forests
Regeneration failure is more likely, particularly if other factors (reduced precipitation, insect infestations) occur with increases in temperature.
A reduction in forested areas also reduces carbon sinks, further exacerbating climate change.

Ice Sheets and Glaciers
At 2°C about 0.5m of sea level rise is expected by 2100 — but potentially locking in 12-20m over the long term.
Eight of the world’s 10 largest cities would face substantial flooding, erosion, and storm surges even at this lower level of sea level rise. Entire island nations will be lost following longer term locked in sea level rise.

Coastal Systems
Mangrove ecosystems will experience mass mortality (also switching from a carbon sink to a carbon source, exacerbating climate change.)
Coral reef ecosystems will be completely lost.

Atmosphere / Ocean Systems
AMOC — Further AMOC weakening is predicted and collapse more possible.
El Niño Southern Oscillation — amplification more likely (predicted to occur in the 1.5°C–4°C range.)

Permafrost Thaw
Impacts thought to be significantly more severe and damaging to infrastructure of Indigenous communities past 2°C, even though every 10th of a degree has significantly worse impacts (note that the Arctic is warming at 4x the rate of the rest of the world.)
Predicted impacts of 3°C of warming by 2100
We are currently headed for 3.2°C if we implement all current policies quickly.

Severe weather and climate events and their impacts on humans
22%
projected increase in global average duration of droughts (range of 15–28%.)
51%
projected increase in global average frequency of droughts (range of 34-63%.)
30–50%
projected decrease in agricultural labour productivity in sub Saharan Africa and Southeast Asia due to heat stress, leading to an increase in food prices.
Persistent heat in some areas, including some densely populated areas no longer farmable or even habitable.
Massive crop yield losses anticipated, increasing the risk of major hunger catastrophes.
250,000
projected increase in the number of deaths by 2050 due to malaria, heat, childhood malnutrition, and diarrhoea (with more than 50% in Africa.)
Year round exceedance of deadly heat thresholds are anticipated for some regions of Africa by 2100
3x
increased risk of climate-related mortality in Europe compared to 1.5°C.
40%
reduction in hydropower potential projected for the Mediterranean.
Adverse impacts on all food sectors will become prevalent impacting food availability, food security, and food access, increasing poverty, particularly in vulnerable regions.
All other impacts noted at lower temperatures will be worse at 3°C.

Biodiversity loss
At 3.2°C the number of species that will lose most of their ranges estimated to be
26%
of vertebrates
(included mammals)
44%
of plant species
49%
of insect species
12%
of species will be at high risk of extinction, with rates of ecosystem extinction on some mountains and islands — including some Biodiversity hotspots — projected to be 80–100%.
Corals and amphibians are particularly vulnerable but many plants, insects, mammals, birds and reptiles.
almost
80%
of marine species across large parts of the tropical Indian and Pacific Ocean will experience dangerous levels of warming.

Tipping points

Amazon Rainforest
The tipping point for transition from rainforest to savannah is more likely, leading to extreme heat stress across Amazonia. See 2°C above.

Boreal Forests
Dieback tipping points for Boreal forests likely reached.

Coastal Systems
Tipping point already breached. See 2°C above.

Atmosphere / Ocean Systems
AMOC — AMOC collapse far more likely.
El Niño Southern Oscillation, amplification more likely (predicted to occur in the 1.5°C–4°C range.)

Ice Sheets and Glaciers
Ice Sheet Melting — would lead to approximately 1m of sea level rise by early 2100s (but potentially locking in a 20m rise over 1000-2000 years.)
Greenland Ice Sheet — tipping point will be triggered, and irreversible loss of sheet locked in (committing about 7m.)
West Antarctic Ice Sheet — collapse tipping point is also likely (committing about 5m.)
Marine Basins East Antarctic ice sheet collapse — increased risk of tipping point melting (committing 8m.)
Sea level rise would impact hundreds of millions of people living in coastal regions (including a majority of mega cities) as well as millions more through impacts on monsoon patterns.
Bangladesh, India, Indonesia, and the Philippines are projected to experience the highest increases in populations living within the flood risk zone. People living in low lying islands (eg. atoll islands) will lose their entire nations — and at less severe levels, their livelihoods if coasts are lost impacting maritime fishing zones and communities.
Mountain glaciers — would be lost.

Permafrost Thaw
Local tipping points likely reached with abrupt thaw in specific regions.

Compounding Effects
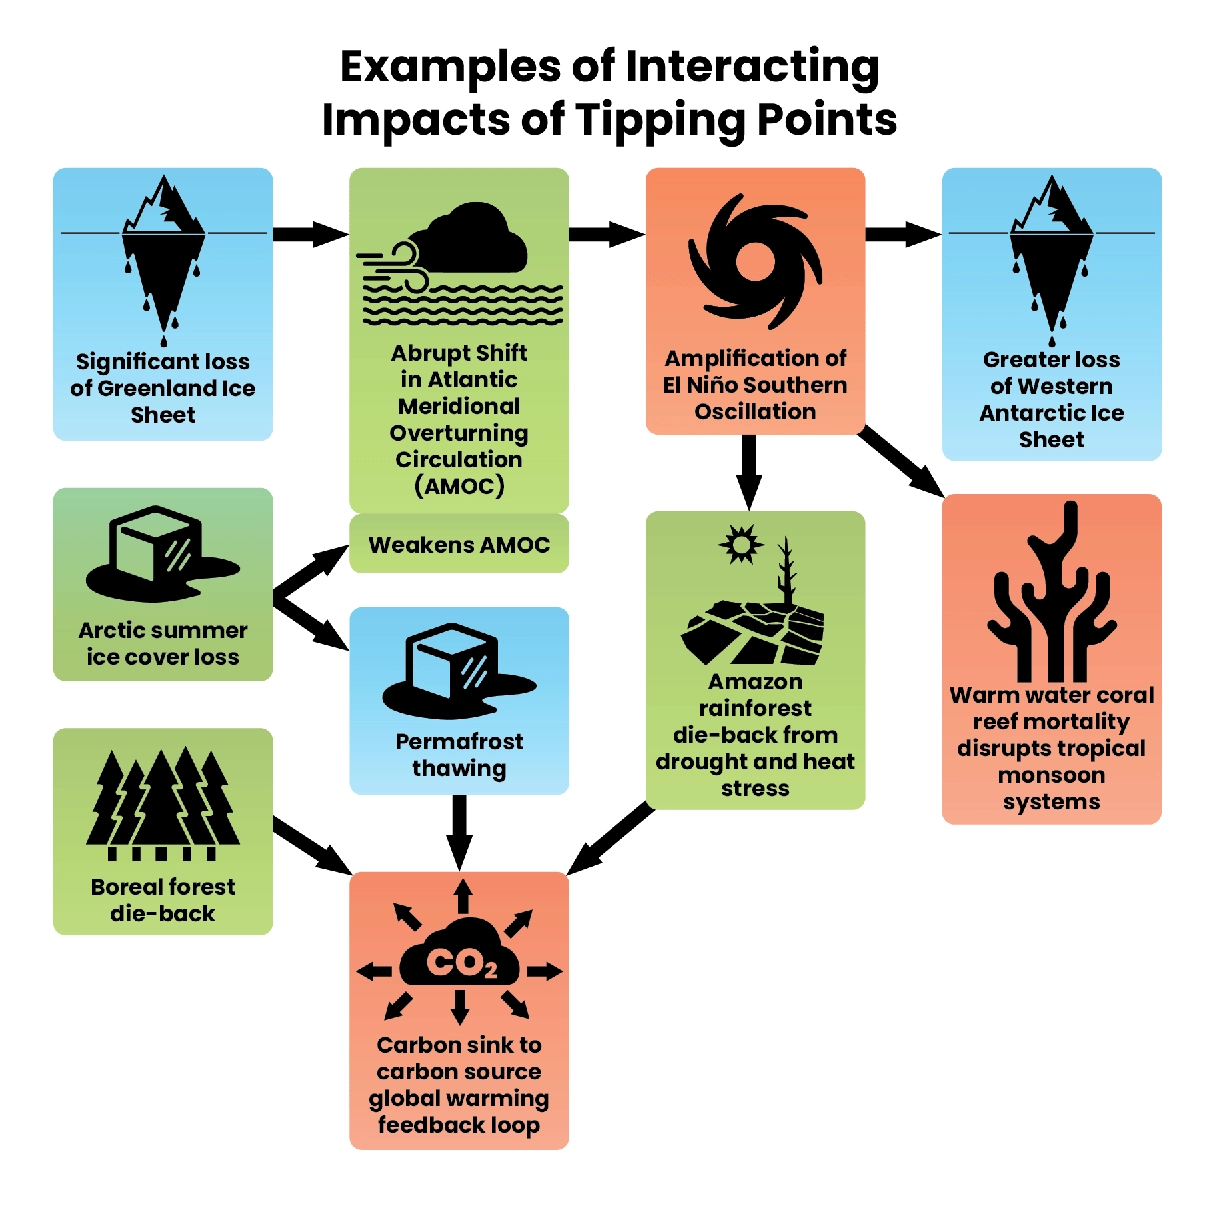
Crossing of one or more tipping points increases the likelihood of other tipping points being passed, and can cause self-reinforcing feedback loops making climate change even worse and out of our control.
Predicted impacts of 4°C of warming by 2100
Where we were headed prior to any action — and where we will be if we don’t implement current policies.

Severe weather and climate events and their impacts on humans
4-5x
projected increase in flood damage as compared to 1.5°C.
50%–70%
projected increase in global area burned.
4 billion
people projected to experience water scarcity.
9 million
projected climate-related deaths per year by 2100.
75x
percent increase in climate-related cardiovascular disease mortality will be approached by the 2050s as compared to the 1980s.
Widespread, global, severe and/or catastrophic societal impacts.

Loss of Biodiversity, species shifts, and disruption to ecosystems
e.g. in Southwest Australia and the Amazon-Guianas a 4.5°C rise is projected to make current habitats unsuitable for:
90%
of amphibians
86%
of birds
80%
of mammals — dramatically increasing risk of local extinction.
The Amazon could lose
69%
of its plant species.
60%
of all species would be at risk of localized extinction in Madagascar.
The Fynbos in the Western Cape Region of South Africa could face localized extinction of a third of its species (many of which are unique to that region.)
Many other species across the globe will be impacted. Overall,
50%
of species could be lost from 35 key Biodiversity regions.
13–14%
(up to 48% at 5°C)
of species will be at high risk of extinction.
Local extinctions are predicted for 50% of tropical marine species and biome shifts (changes in major vegetation composition of an ecosystem) predicted across 35% of global land area.

Tipping points

Amazon Rainforest
Large scale dieback likely and collapse possible. Transition from rainforest to savannah.

Ice Sheets and Glaciers
Multiple tipping points breached locking in up to 22 metres of irreversible sea level rise over long term.

Atmosphere / Ocean Systems
AMOC — collapse far more likely.

Boreal Forests
Dieback tipping point likely breached.

Coastal Systems
Tipping points already breached at lower threshold.

Permafrost
Local tipping points with abrupt thaw likely, significant loss of permafrost area.
All tipping points have significant societal and ecosystem impacts and carry the risk of tipping other systems and causing runaway climate change.
Costs of Action vs Cost of Inaction
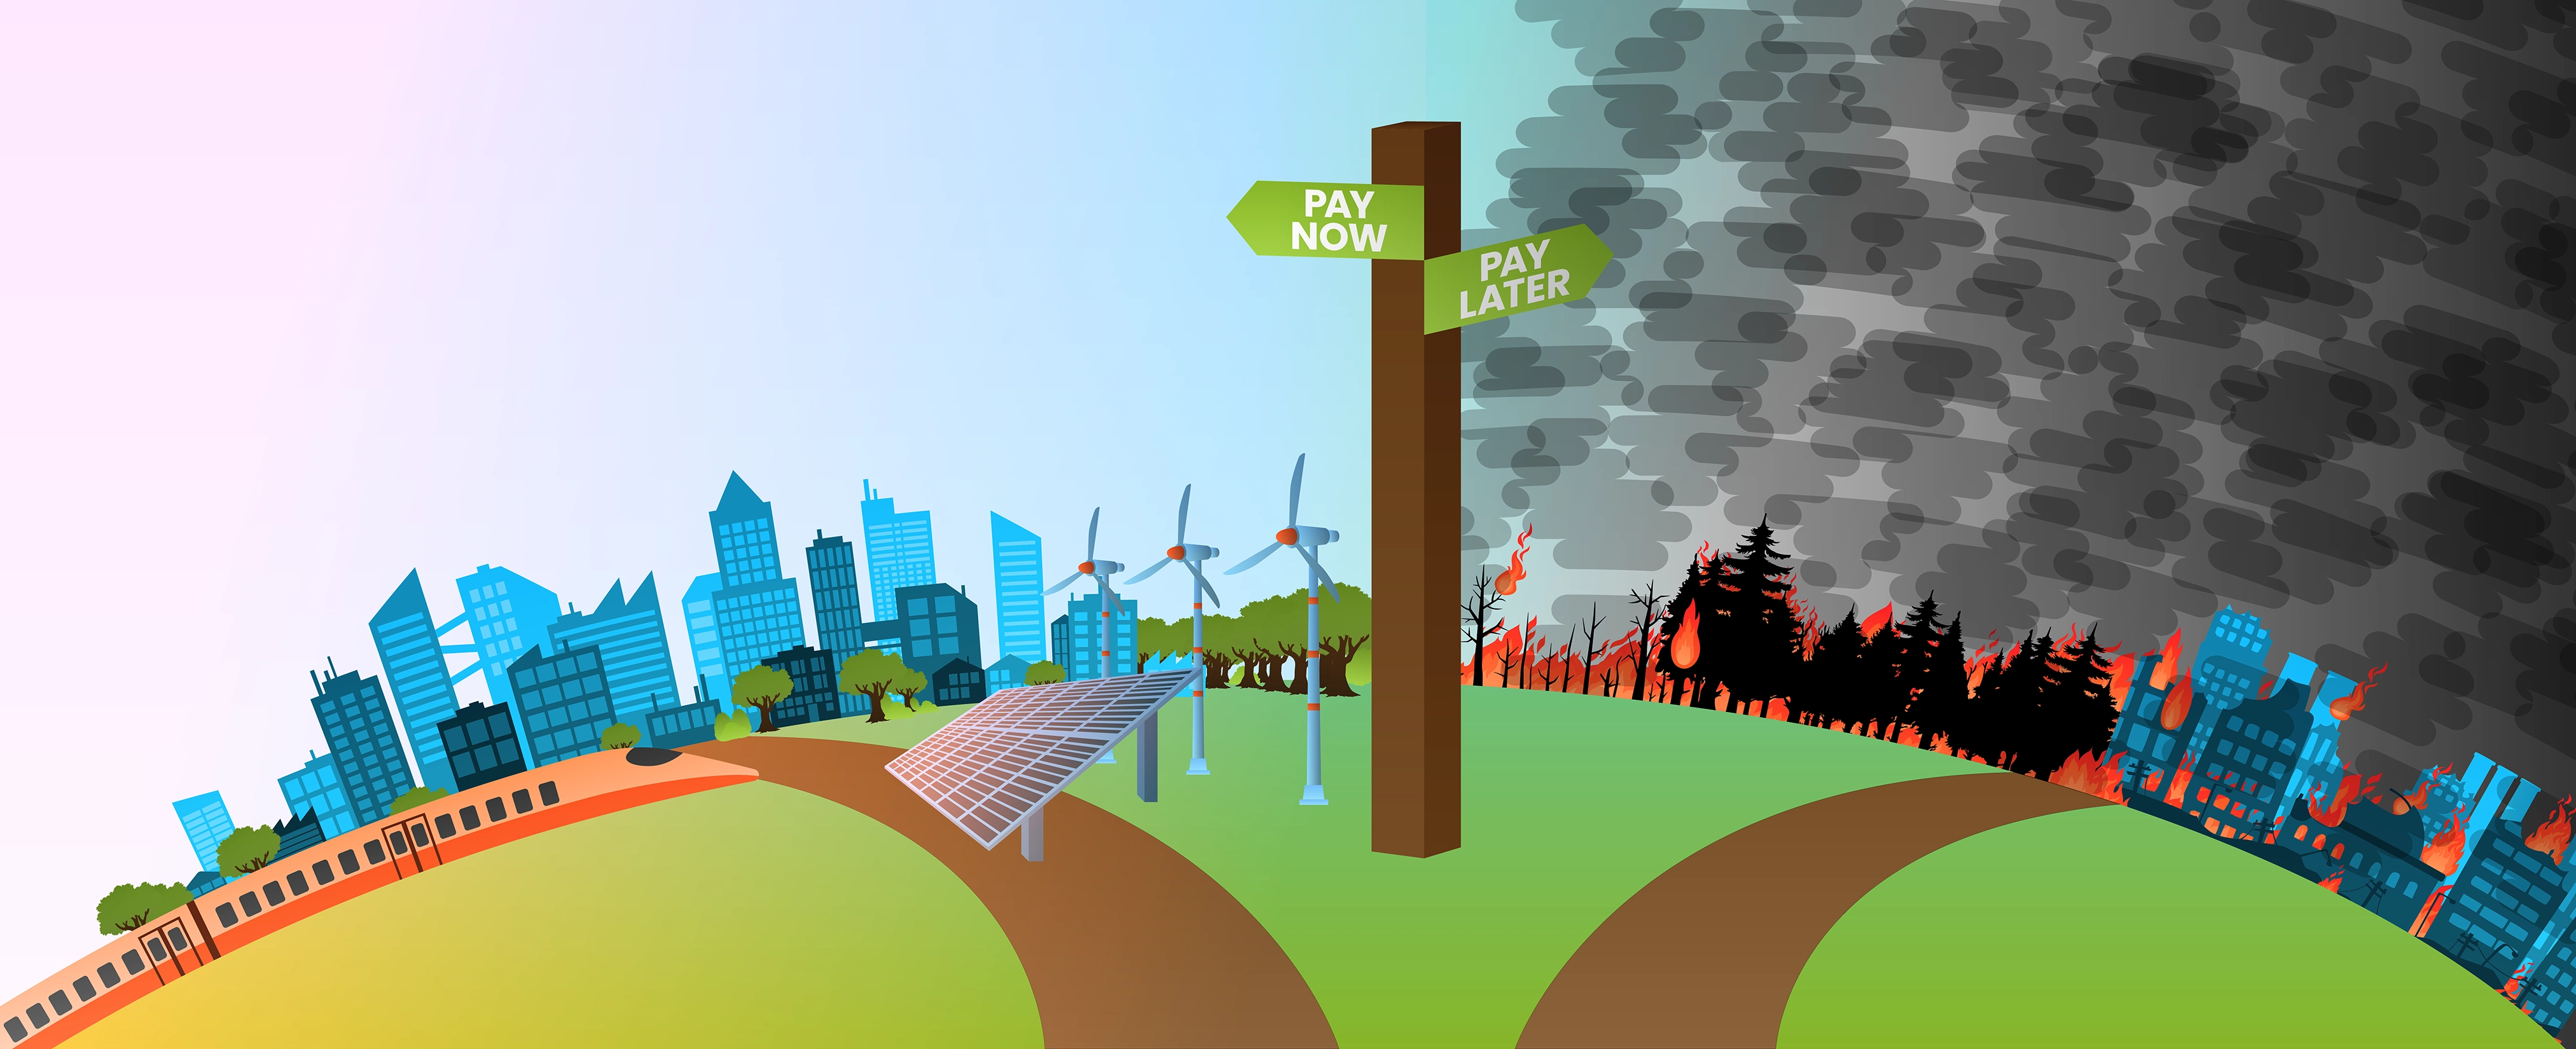
We are paying for the climate crisis in addition to funding it. Let’s pay to address it instead. We know what we need to do.
Climate change is costing Canadians as well.
According to research conducted by the Canadian Climate Institute, climate-related damages from extreme weather events are already costing Canadian households $700 per year in taxes directed towards disaster recovery and infrastructure repairs, rising home insurance premiums and climate related impacts on grocery bills.
Over the last 50 years, severe weather events in Canada have increased from 10s of millions of dollars to billions of dollars per year.
Between 2010 and 2019, insured losses for catastrophic weather events totalled over $18 billion and the number of catastrophic events has more than tripled as compared to the 1980s.
Loss and damage costs have risen from an average of $8.3 million per event in the 1970s to an average of $112 million per event in the 2000s.
Climate costs have climbed to the equivalent of 5-6% of our GDP.
And while it is important to focus on the more visible and direct costs in loss and damage, community displacement, impacts on Indigenous communities, impacts of health and wellbeing and cost of living, impacts on wildlife and severe threats to specific species, impacts on agriculture and food security, etc. it is also important to realize that most businesses experience or will experience interruptions, supply chain disruption, worker productivity impacts, and other climate risks as well.
The impacts of climate change are only going to increase, and more steeply the less we spend on mitigation (e.g. moving to clean energy) and adaptation (building resilience to withstand the impacts of climate change.)
Climate action to mitigate global warming and prevent the worst impacts of climate change costs money. The amount of change we need to make is no small feat and will require significant investment.
That said, some of the ‘costs’ of the transition are investments in new technology and sustainable jobs, infrastructure upgrades (that are needed anyway) and/or upfront investments that pay for themselves over time.
Utility scale solar PV is now less expensive than fossil fuels. Heat pumps, EVs, and residential solar have upfront costs but pay for themselves and then some over time. Newer, more affordable options are also on the way as solutions scale.
While the costs for existing solutions will continue to decrease over time, the costs to address the crisis will only increase the longer we delay.
With each degree of warming, there is increasing financial need and increasing competition for money across the 3 main areas of action below. We will pay one way or another. Better to invest in mitigating solutions now and avoid greater costs across the board later.
The longer we delay:

Climate Mitigation — More expensive/wild card/moonshot solutions will be required (eg CCS, geoengineering) and more aggressive and costly timescales will be required for deployment.
Also — the worse climate change gets, the more risks there are to current clean solutions. For example, droughts impact the effectiveness of hydropower (sometimes causing countries to fire up climate killing coal); tipping point level changes to weather patterns can impact solar and wind investments; reforestation efforts can be thwarted by wildfires or climate-related damage from invasive species.
Delay also locks in further high-emissions infrastructure (new oil and gas projects, gas lines for new housing developments, new gas cars, etc) for decades or increases the costly risk of stranding assets (where an investment is made in something that is abandoned before the full value is derived from it (e.g. you buy a new gas furnace instead of a heat pump but then have to switch to a heat pump anyway before you get your 10 years-worth of value out of your furnace))

Climate Adaptation — More adaptation is needed as more regions and populations are impacted and climate risks are greater/more severe.
Also — the worse we let the situation get, the more risks there are to current adaptation solutions. For example, seawalls are only effective up to a certain level of sea level rise/flooding risk, at some point, cities will need to be moved (as is the case for Jakarta, in part due to climate change.)
Finally, some adaptations are more difficult to align with a Net Zero world at a larger scale — eg. increased use of air conditioning to improve resilience to heat waves causes increases in energy usage.

Loss and Damage — There is greater loss and damage as more regions and populations are impacted and as impacts are more severe and frequent due to increasing temperatures.
Also — the worse we let the situation get, the more likely we will hit catastrophic tipping point changes and collapses in earth systems.
In 2023, the loss and damage fund for developing nations (who contributed little to the problem but experience the worst impacts) that was established at the COP27/28 meetings, held only 0.2% of the irreversible economic and non-economic loss and damage developing nations face each year.

The Issue Is Big
All of this may make you feel as though the problem is too big. In fact, it is so big that it is hard to believe it is actually true.
How could this have happened when people predicted the impacts of greenhouse gas emissions over 50 years ago and have only gained clarity and confidence in these predictions since? Why isn’t everyone already treating it like an emergency? Why are some people still even denying it and treating it as though a few degrees is not a big deal? All good questions.
It is real and it is big. But it gets worse if we don’t roll up our sleeves and get through the energy transition.

We don’t have the luxury of throwing up our hands or turning away from the problem; if everyone had done that the threat we face would literally have been existential. We are not yet out of the woods.

We have many solutions now to alter our current path dramatically for the better. We just need to implement them. (see more further into this website.)

A lot of people are already working on it, but they need us to get on board and join the transition to succeed.

Each person’s actions matter (particularly in the developed world). We have no choice but to reduce our emissions and stop burning fossil fuels wherever possible.
And there is so much serious recent momentum in the right direction among governments and the private sector.
We can do this.
Once we succeed, we will be living better, healthier, more compassionate, less wasteful, and less polluting lives as well.
Last updated: October 2024
References
References
Background and general resources
1. Scott, M. (2014a, September 17). What’s the hottest earth has been “lately”? NOAA Climate. https://www.climate.gov/news-features/climate-qa/what%E2%80%99s-hottest-earth-has-been-%E2%80%9Clately%E2%80%9D
2. Mortillaro, N. (2024, January 9). 2023 was the hottest year on record — by a long shot. CBCnews. https://www.cbc.ca/news/science/2023-hottest-year-on-record-1.7077959
3. Lindsey, R. (2022, October 12). How do we know the build-up of carbon dioxide in the atmosphere is caused by humans?. NOAA Climate.gov. https://www.climate.gov/news-features/climate-qa/how-do-we-know-build-carbon-dioxide-atmosphere-caused-humans
4. University of Exeter Global Systems Institute. (2023, December 7). Global Tipping Points. https://global-tipping-points.org/
5. IPCC. (2023, March). AR6 Synthesis Report: Climate Change 2023. https://www.ipcc.ch/report/sixth-assessment-report-cycle/
6. IPCC. (2023). Summary for Policymakers. In: Climate Change 2023: Synthesis Report. Contribution of Working Groups I, II and III to the Sixth Assessment Report of the Intergovernmental Panel on Climate Change. IPCC. https://www.ipcc.ch/report/ar6/syr/downloads/report/IPCC_AR6_SYR_SPM.pdf
7. McCarthy, J. (2021, July 30). Climate Crisis: What’s the Difference Between a Rise of 1.5, 2, and 3 Degrees Celsius? Global Citizen.https://www.globalcitizen.org/en/content/the-difference-in-global-warming-levels-explained/
8. Lindwall, C. (2022, October 24). What are the effects of climate change?. NRDC. https://www.nrdc.org/stories/what-are-effects-climate-change#weather
9. World Wildlife Fund. (2018, March). 2021 WWF-US Annual Report. Wildlife in a Warming World. https://files.worldwildlife.org/wwfcmsprod/files/FinancialReport/file/7g37j96psg_WWF_AR2021_spreads.pdf
10. Hausfather, Z. (2024, April 24). State of the climate: 2024 off to a record-warm start. Carbon Brief. https://www.carbonbrief.org/state-of-the-climate-2024-off-to-a-record-warm-start/#:~:text=by%20Carbon%20Brief.-,Carbon%20Brief’s%20projection%20suggests%20that%202024%20is%20virtually%20certain%20to,C%2C%20slightly%20higher%20than%202023
Severe weather and climate events — impacts on humans
11. Ten extreme climate events of 2023. PreventionWeb. (2024, January 16). https://www.preventionweb.net/news/ten-extreme-climate-events-2023
12. Al Jazeera. (2023, December 27). Photos: Natural disasters that plagued the world in 2023. Al Jazeera. https://www.aljazeera.com/gallery/2023/12/27/natural-disasters-that-plagued-the-world-in-2023
13. Mlaba, K., Lowery, T., & Banjo, F. (2023, November 7). Shocking photos of extreme weather around the world in 2023 so far. Global Citizen. https://www.globalcitizen.org/en/content/photos-extreme-weather-events-2023-climate-change/
14. Natural Disasters 2023: Year Of Tragic Record-Breaking. EOS Data Analytics. (2024, May 16). https://eos.com/blog/natural-disasters-2023/
15. NASA. (n.d.). International disaster charter activations. NASA. https://eol.jsc.nasa.gov/ESRS/Disasters/ShowIDCTracking.pl#2012
16. Tsegai, D., Augenstein, P., & Huang, Z. (2023). Global drought snapshot 2023. UNCCD. https://www.unccd.int/sites/default/files/2023-12/Global%20drought%20snapshot%202023.pdf
17. Center for Disaster Philanthropy. (2024, June 10). https://disasterphilanthropy.org/
18. FloodList – floods and flooding news from around the world. (n.d.). https://floodlist.com/
19. Mapped: How climate change affects extreme weather around the world. Carbon Brief. (2024, January 15). https://www.carbonbrief.org/mapped-how-climate-change-affects-extreme-weather-around-the-world/
20. Magramo, K. (2022, June 29). 7 million in Bangladesh Need Aid after “worst floods in memory,” Red Cross says. CTVNews. https://www.ctvnews.ca/world/7-million-in-bangladesh-need-aid-after-worst-floods-in-memory-red-cross-says-1.5967602
21. Dunne, D. (2023, October 25). Analysis: Africa’s extreme weather has killed at least 15,000 people in 2023. Carbon Brief. https://www.carbonbrief.org/analysis-africas-extreme-weather-have-killed-at-least-15000-people-in-2023/
22. AFP. (2023, August 13). Morocco breaks heat record. Phys.org. https://phys.org/news/2023-08-morocco.html
23. Walsh, M. (2023, June 22). Beijing records hottest June Day as extreme heat sears northern china. Phys.org. https://phys.org/news/2023-06-beijing-temperatures-extreme-northern-china.html
24. Aubourg, L. (2023, July 14). Record-breaking heat bakes us, Europe, China. Phys.org. https://phys.org/news/2023-07-record-breaking-europe-china.html
25. AFP. (2023, July 10). Europe in summer: Scorching new normal. Phys.org. https://phys.org/news/2023-07-europe-summer.html
26. European Commission. (n.d.). Consequences of climate change. https://climate.ec.europa.eu/climate-change/consequences-climate-change_en
European Commission. (n.d.). Consequences of climate change. https://climate.ec.europa.eu/climate-change/consequences-climate-change_en
27. World Health Organization. (2023d, October 12). Climate change. https://www.who.int/news-room/fact-sheets/detail/climate-change-and-health
28. Lindsey, R. (2023, October 30). Drought parches the central amazon in October 2023. NOAA Climate.gov. https://www.climate.gov/news-features/event-tracker/drought-parches-central-amazon-october-2023
29. Thiem, H. (2023, August 14). Major flood outburst from Mendenhall Glacier in Alaska not possible without climate change. NOAA Climate.gov. https://www.climate.gov/news-features/event-tracker/major-flood-outburst-mendenhall-glacier-alaska-not-possible-without
30. Di Liberto, T. (2021, June 30). Astounding heat obliterates all-time records across the Pacific Northwest and Western Canada in June 2021. NOAA Climate.gov. https://www.climate.gov/news-features/event-tracker/astounding-heat-obliterates-all-time-records-across-pacific-northwest
31. Di Liberto, T. (2020, August 26). Over a million acres burned in California in second half of August 2020. NOAA Climate.gov. https://www.climate.gov/news-features/event-tracker/over-million-acres-burned-california-second-half-august-2020
32. Brackley, C. (2023, September 1). Mapping 100 years of forest fires in Canada. https://canadiangeographic.ca/articles/mapping-100-years-of-forest-fires-in-canada/
33. Government of Canada. (2023, November 2). National Wildland Fire Situation Report. Canadian Wildland Fire Information System. https://cwfis.cfs.nrcan.gc.ca/report
34. MacCarthy, J., Richter, J., Tyukavina, S., Weisse, M., & Harris, N. (2023, August 29). The Latest Data Confirms: Forest Fires Are Getting Worse. https://www.wri.org/insights/global-trends-forest-fires
35. Wikimedia Foundation. (2024, January 4). 2021 European floods. Wikipedia. https://en.wikipedia.org/wiki/2021_European_floods#:~:text=Germany,-Flood%20damage%20in&text=With%20at%20least%20184%20deaths,it%20difficult%20to%20call%20people
36. WWF Australia. (n.d.). In-depth: Australian Bushfires. WWF Australia. https://wwf.org.au/what-we-do/australian-bushfires/in-depth-australian-bushfires/#:~:text=The%202019%2D20%20Australian%20bushfires,were%20impacted%20by%20the%20blazes
37. Roach, J. (2020, January 8). Australia wildfire damages and losses to exceed $100 billion, AccuWeather estimates. https://www.accuweather.com/en/business/australia-wildfire-economic-damages-and-losses-to-reach-110-billion/657235#:~:text=AccuWeather%20estimates%20the%20total%20damage,on%20a%20variety%20of%20sources
38. Harmstone, A. (2020, February). Five Sectors That Cannot Escape Climate Change. Morgan Stanley. https://www.morganstanley.com/im/publication/insights/articles/articles_fivesectorsthatcannotescapeclimatechange_us.pdf
39. Save the Children International. (2023, December 20). 2023 in review: Climate disasters claimed 12,000 lives globally in 2023. Save the Children International. https://www.savethechildren.net/news/2023-review-climate-disasters-claimed-12000-lives-globally-2023
40. Seppelt, R., Klotz, S., Peiter, E., & Volk, M. (2022, November 10). Agriculture and Food Security under a changing climate: An underestimated challenge. iScience. https://www.sciencedirect.com/science/article/pii/S2589004222018235
41. Clean Energy Canada. (2023, June 8). Media brief: The link between wildfires and other extreme weather and climate change. Clean Energy Canada. https://cleanenergycanada.org/the-link-between-extreme-weather-and-climate-change/
Biodiversity impacts with impacts for humans
42. Hoegh-Guldberg, O., Poloczanska, E. S., Skirving, W., & Dove, S. (2017, May 10). Coral reef ecosystems under climate change and ocean acidification. Frontiers in Marine Science. https://www.frontiersin.org/articles/10.3389/fmars.2017.00158/full#:~:text=Warm%2Dwater%20coral%20reefs%20are,et%20al.%2C%201999b
43. Waits, A., Emelyanova, A., Oksanen, A., Abass, K., & Rautio, A. (2018, October 11). Human infectious diseases and the changing climate in the Arctic. Science Direct. https://www.sciencedirect.com/science/article/pii/S0160412018312005
44. World Wildlife Fund. (2018, March). 2021 WWF-US Annual Report. Wildlife in a Warming World. https://files.worldwildlife.org/wwfcmsprod/files/FinancialReport/file/7g37j96psg_WWF_AR2021_spreads.pdf
45. Mandavilli, A. (2023, February 15). How climate change is spreading malaria in Africa. The New York Times.https://www.nytimes.com/2023/02/14/health/malaria-mosquitoes-climate-change.html
46. Luedtke, J. A., Chanson, J., Neam, K., Hobin, L., Maciel, A. O., Catenazzi, A., Borzée, A., Hamidy, A., Aowphol, A., Jean, A., Sosa-Bartuano, Á., Fong G., A., de Silva, A., Fouquet, A., Angulo, A., Kidov, A. A., Muñoz Saravia, A., Diesmos, A. C., Tominaga, A., … Stuart, S. N. (2023, October 4). Ongoing declines for the world’s amphibians in the face of emerging threats. Nature News. https://www.nature.com/articles/s41586-023-06578-4
47. International Fund for Animal Welfare. (2023, August 9). Which animals are most impacted by climate change?. IFAW. https://www.ifaw.org/ca-en/journal/animals-most-impacted-climate-change
48. Warren, R., Price, J., Graham, E., Forstenhaeusler, N., & Vanderwal, J. (2018, May 18). The projected effect on insects, vertebrates, and plants of limiting global warming to 1.5°C rather than 2°C. Science.org. https://www.science.org/doi/10.1126/science.aar3646
Earth system shifts and tipping point changes
49. Carrington, D. (2022, September 8). World on brink of five “disastrous” climate tipping points, study finds. The Guardian. https://www.theguardian.com/environment/2022/sep/08/world-on-brink-five-climate-tipping-points-study-finds
50. Igini, M. (2023, August 14). The tipping points of climate change: How will our world change?. Earth.Org. https://earth.org/tipping-points-of-climate-change/
51. IPCC. (2023, March). AR6 Synthesis Report: Climate Change 2023. https://www.ipcc.ch/report/sixth-assessment-report-cycle/
52. 2023 Antarctic Sea Ice Winter maximum is lowest on record by a wide margin. NOAA Climate.gov. (2023, September 25). https://www.climate.gov/news-features/event-tracker/2023-antarctic-sea-ice-winter-maximum-lowest-record-wide-margin
53. United Nations. (2022, January 30). If you’re not thinking about the climate impacts of thawing permafrost, (here’s why) you should be. UN News. https://news.un.org/en/story/2022/01/1110722#:~:text=Back%20in%202019%2C%20the%20United,a%20significant%20loss%20in%20coverage
54. Pravettoni, R., & Rekacewicz, P. (2024). Permafrost and climate change. GRID. https://www.grida.no/resources/13348
55. Cohen, A. (2023, August 30). Sinking Permafrost Sinks Pipelines in Russia and Canada. Forbes. https://www.forbes.com/sites/arielcohen/2023/08/30/sinking-permafrost-sinks-pipelines-in-russia-and-canada/?sh=3b94fff16036
56. Bednaršek, N., Bellerby, R., Droste, E. S., Dupont, S., Findlay, H. S., González, H. E., Henley, S., Thor, P., & Wassmann, P. (2023, November). State of the Cryosphere 2023: Two Degrees Is Too High. https://drive.google.com/file/d/1QOqYHI0ezrmMCUrmCDV03rF-1aIYE6VB/view
Costs of inaction including risks to solutions
57. Cho, R. (2019, June 20). How Climate Change Impacts the Economy. State of the Planet. https://news.climate.columbia.edu/2019/06/20/climate-change-economy-impacts/
58. Bowman, J. (2022, January 10). 2021 Weather Disasters Show Mounting Costs of Inaction. NRDC. https://www.nrdc.org/bio/john-bowman/2021-weather-disasters-show-mounting-costs-inaction
59. Limaye, V. (2021, May 20). The Costs of Inaction: The Economic Burden of Fossil Fuels and Climate Change on Health in the U.S. NRDC. https://www.nrdc.org/resources/costs-inaction-economic-burden-fossil-fuels-and-climate-change-health-us
60. Khrennikova, D., & Tanas, O. (2021, April 14). Climate Change Threatens Russia With Billions in Annual Costs. Bloomberg.com. https://www.bloomberg.com/news/articles/2021-04-14/climate-change-may-be-costing-russia-billions-every-year
61. OECD. (2023, November 17). The Climate Action Monitor 2023. OECD. https://www.oecd.org/climate-action/ipac/the-climate-action-monitor-2023-60e338a2/chapter-d1e2800
62. Sigal, L., & Raszewski, E. (2023, March 9). Argentina’s “unprecedented” drought pummels farmers and economy. Reuters. https://www.reuters.com/business/environment/argentinas-unprecedented-drought-pummels-farmers-economy-2023-03-09/
63. Nagchoudhary, S., & Paul, R. (2020, May 23). Cyclone Amphan loss estimated at $13 billion in India, may rise in Bangladesh. Reuters. https://www.reuters.com/article/us-asia-storm-india-idUSKBN22W0MT
64. Orr, B., & Li, Q. (2023, October 10). Losses from China disasters reach $42 billion in first nine months of 2023. Reuters. https://www.reuters.com/world/china/losses-china-disasters-reach-42-bln-first-nine-months-2023-2023-10-09/
65. Martin-Richon, M. (2023, June 14). Climate damages are inflating the costs of living for every Canadian. Canadian Climate Institute. https://climateinstitute.ca/climate-damages-inflating-costs-of-living-for-every-canadian/
66. Sawyer, D., Ness, R., Clark, D., & Beugin, D. (2020, December). Tip of the Iceberg: Navigating the Known and Unknown Costs of Climate Change for Canada. Canadian Institute for Climate Choices. https://climatechoices.ca/wp-content/uploads/2020/12/Tip-of-the-Iceberg-_-CoCC-_-Institute-_-Recomendations.pdf
67. Monga, V. (2024, March 27). Canada had designs on being a hydro superpower. now its rivers and lakes are drying up. Wall Street Journal. https://www.wsj.com/us-news/climate-environment/canada-had-designs-on-being-a-hydro-superpower-now-its-rivers-and-lakes-are-drying-up-928ef721
68. Kemp, J. (2023, June 18). Drought-depleted hydropower drives China to turn to coal. Reuters. https://www.reuters.com/markets/commodities/drought-depleted-hydropower-drives-china-turn-coal-kemp-2023-06-16/
69. Diebel, M. (2024, April 29). Here’s another wacky thing caused by climate change: Less wind to create clean electricity. Climate Crisis 247. https://climatecrisis247.com/energy/heres-another-wacky-thing-caused-by-climate-change-less-wind-to-create-clean-electricity/
Other refs
70. Environment and Climate Change Canada. (2023). 2023 Progress Report on the 2030 Emissions Reduction Plan. https://www.canada.ca/content/dam/eccc/documents/pdf/climate-change/climate-plan/healthy_environment_healthy_economy_plan.pdf

